Session History
Home > Select Project > Analysis > Session History
In Session History, you can see what has been performed in a specific session during the query period. It provides information that allows you to check how much resource has been used for SQL for a long-running session and analyze the causes.
Basic usage guide
You must enter the session number (Process ID) to monitor as a required value, but it is more efficient to enter through the Monitoring a Database Instance menu.
-
Go to Dashboard > Monitoring a Database Instance.
-
In the Active Session tab, click a session from the ID column.
-
In Session detail, click Session history
 to move to Session History.
 -
You can view the session history collected for the selected session's process ID (PID).
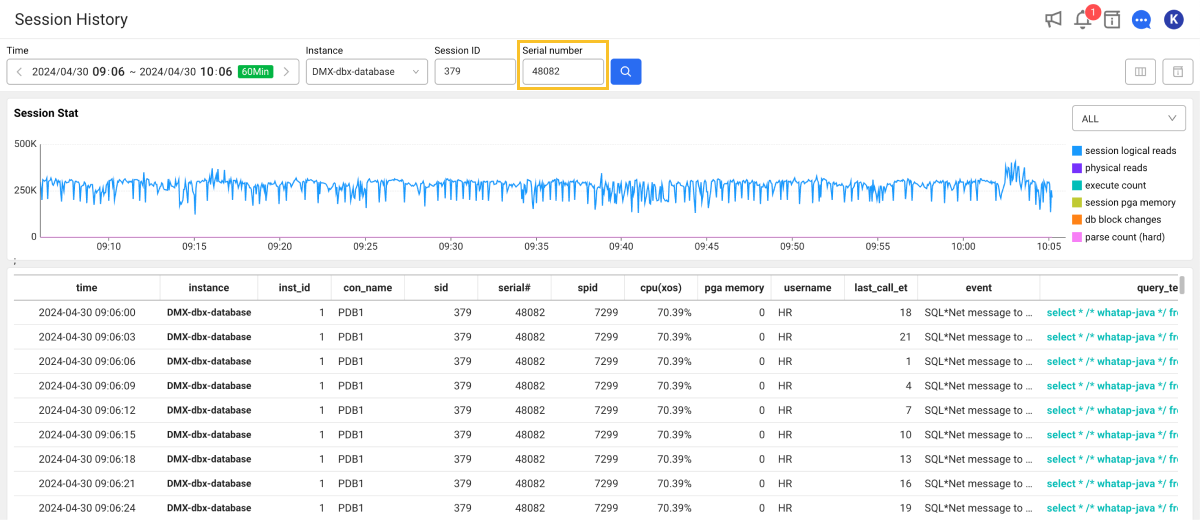
Active session data collected every 5 seconds from the selected session is used to construct a chart and its list and provide information that can be used for analysis.
-
Wait: You can see the percentage of waiting events through a chart.
-
Cpu: You can see the change trend in CPU usage through the chart.
-
Memory: You can see the change trend in memory usage through the chart.
-
Disk I/O: You can see the change trend in disk usage through the chart.
If you select the query column on the utmost right of the list, the SQL details window appears where you can see the SQL statement. It contains full texts and plan information for the selected query.
-
-
If the query_text column is selected in the session table list, the SQL details window appears where you can see the SQL query statement and plan information.
-
You can hide the table header columns or add any of them. You can also change the column order.