Network trend (TCP)
Home > Select Project > Dashboard > Network Trend (TCP)
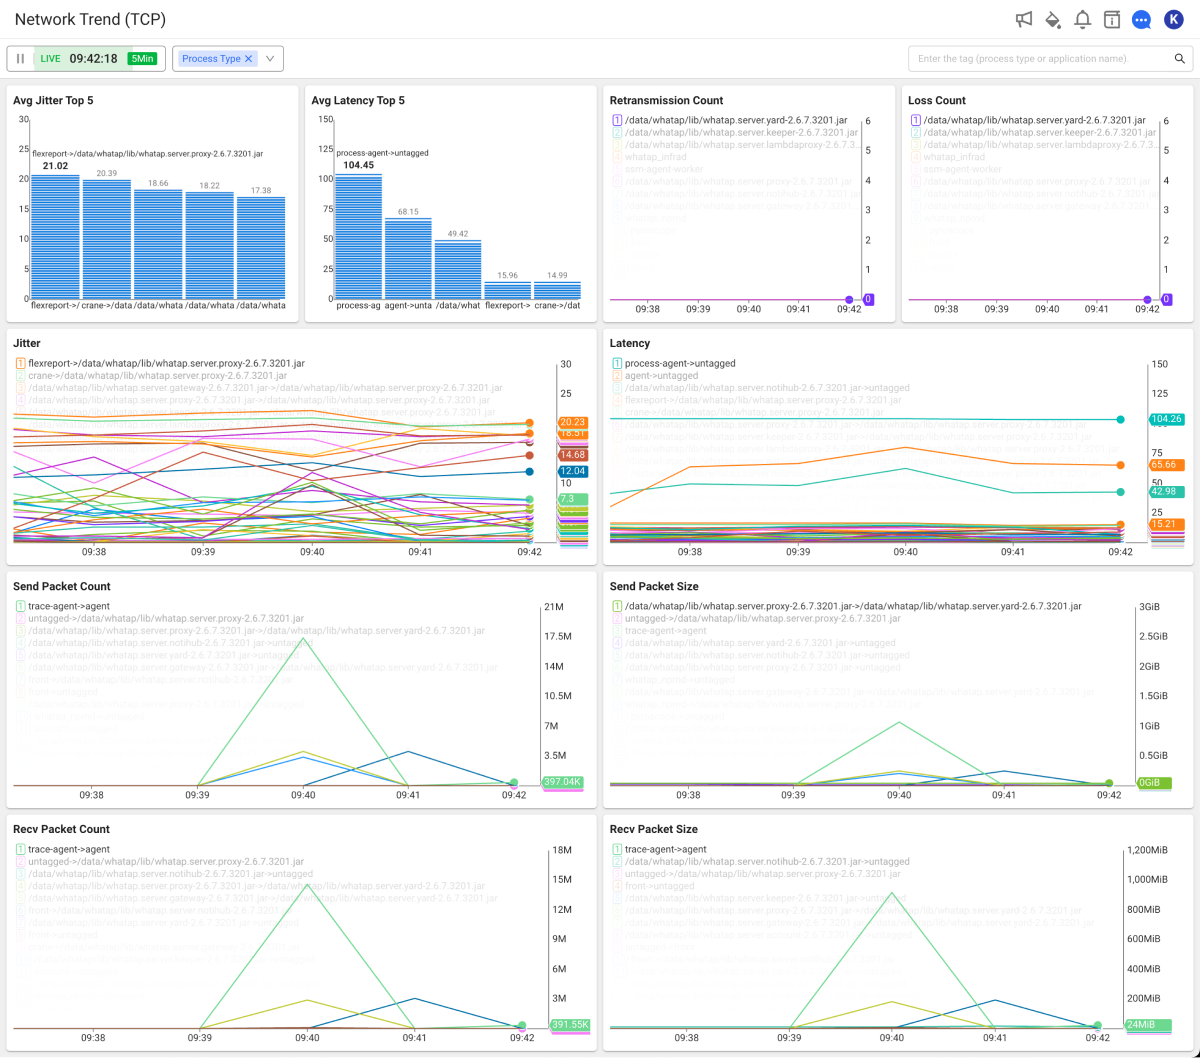
While the Network Topology menu mainly visualizes the network configuration, the Network Trend (TCP) menu allows you to see the performances in a dense manner on a single screen. The performances over time can be displayed in real time, and the performances in the past can be displayed and used as the data to analyze problems.
Configuring the chart options
Setting the lookup time
-
Realtime mode: Searches the data for the time set on the green button in real time.

-
You can click the green button to select a desired time.
-
Click
to pause the real-time data search and then search the data for a desired time.
-
-
Time setting mode: You can see the data by setting a desired time.

-
Click the green button to select a time from various values.
-
By selecting
or
, you can move by the time set on the green button.
-
If you click the text range for date and time, the option appears to select the date and time.
-
To switch to the Realtime mode, select
.
-
Selecting a node type
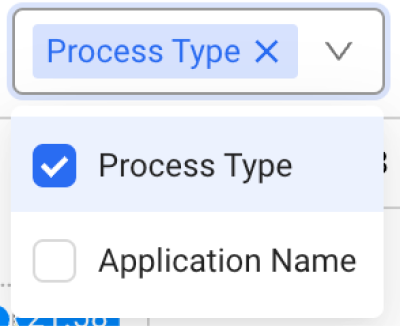
You can select a node type displayed on the chart. Each corresponds to a single tag. Tags are collected depending on the tagRule options you set in the tagRule.yaml file. Nodes can be expressed as Process type and Application name or a combination of the two.
For more information about the tagRule options, see the following.
Searching the node
The search bar on the upper right of the screen allows you to filter the nodes displayed on the chart. The items that do not meet the search word do not appear on the chart.
This is useful when checking only the communication related to specific tags.
Top 5 Charts
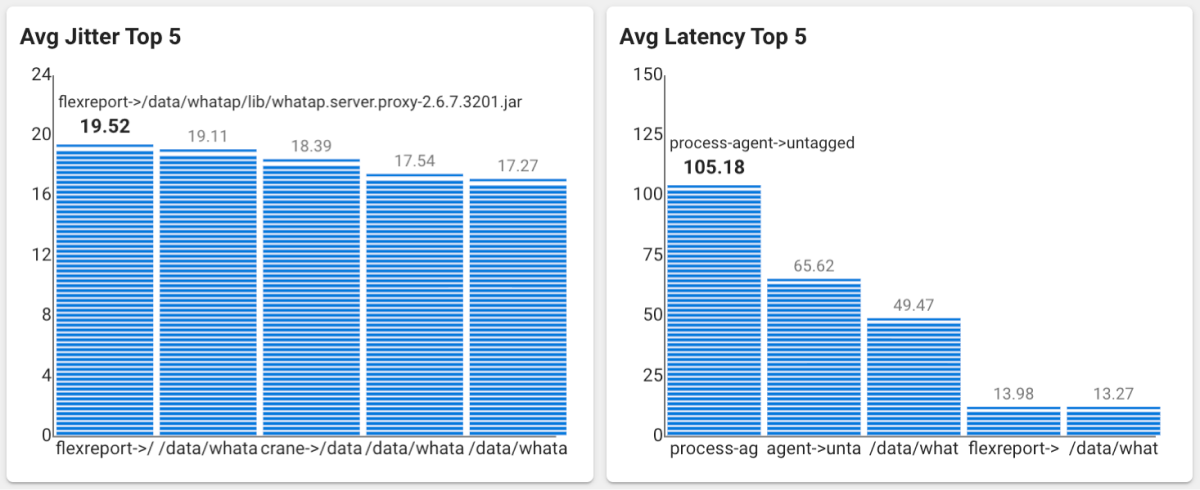
It charts jitter and latency, which are key metrics for communication failures on the network, in the top-five order.
Packet retransmission and loss metrics
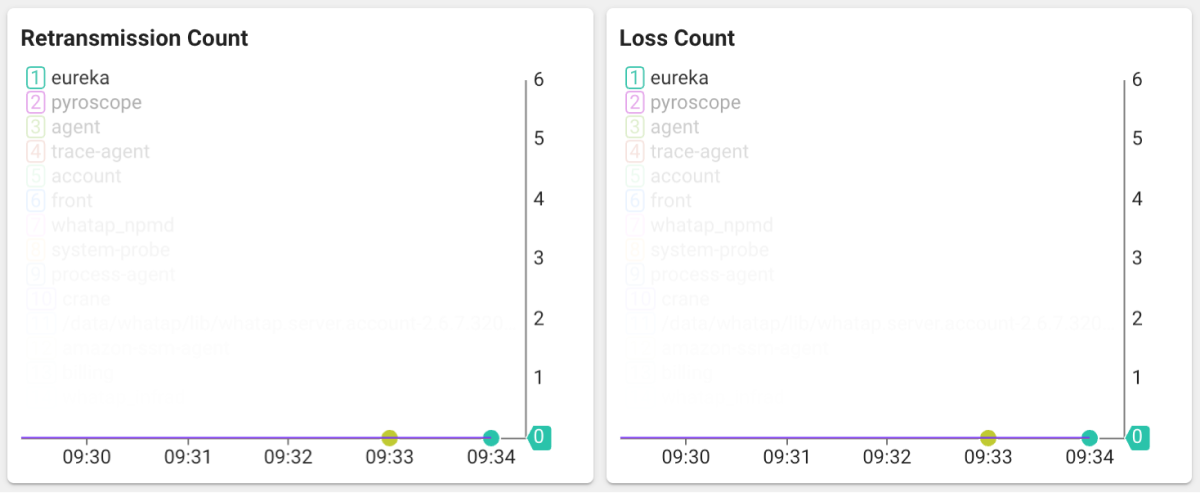
It displays the number of retransmissions in a specific communication section as a chart. In connection with the packet loss count that can cause retransmission, you can check the retransmissions for packet loss.
Latency metric

Network reliability can be evaluated based on the latency and changes in latency.
Data throughput metric
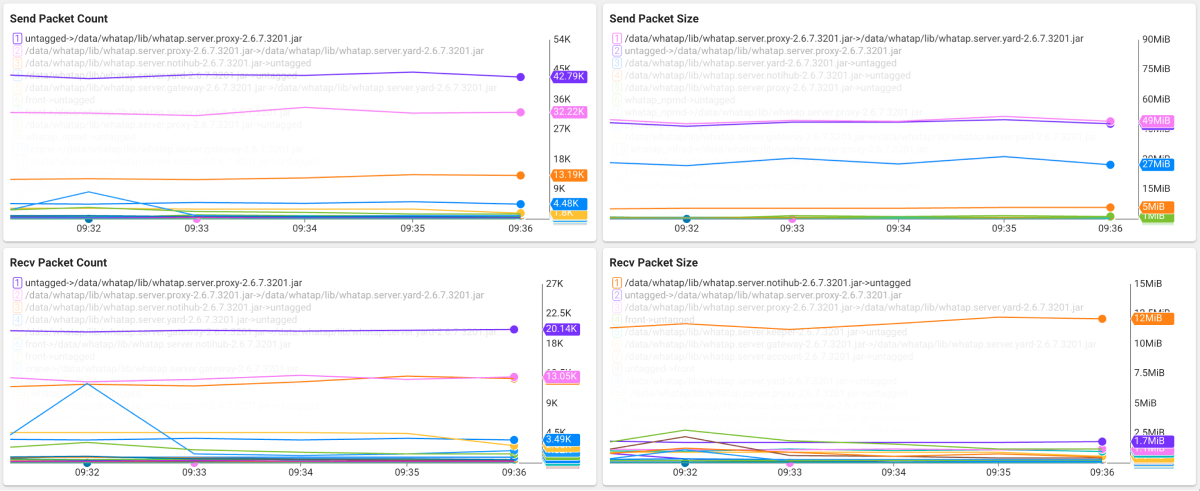
It charts the data throughput (bps or pps) metrics broken down from the send/receive perspective.