Network topology
Home > Select Project > Dashboard > Network topology
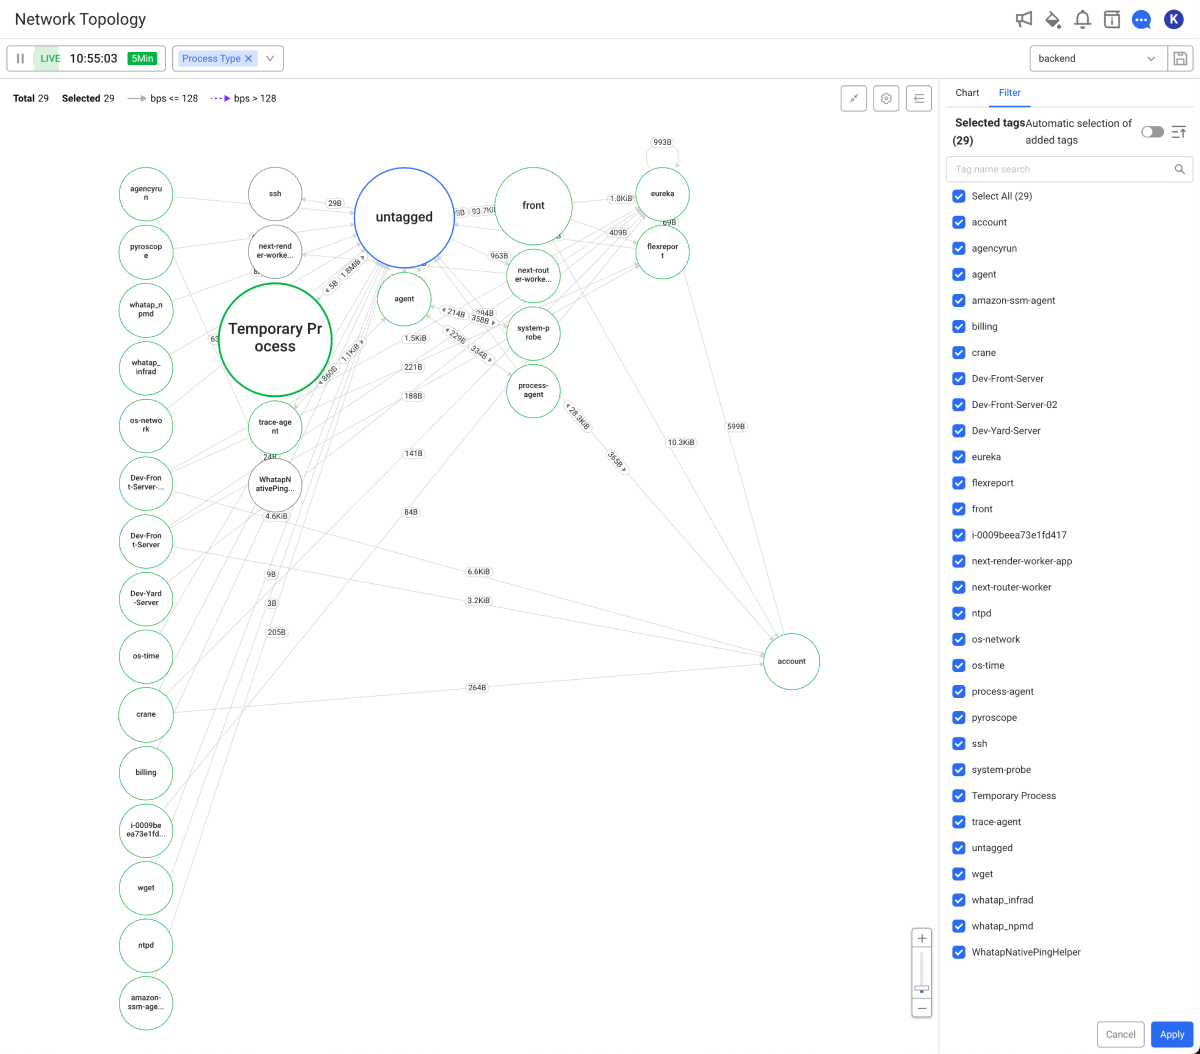
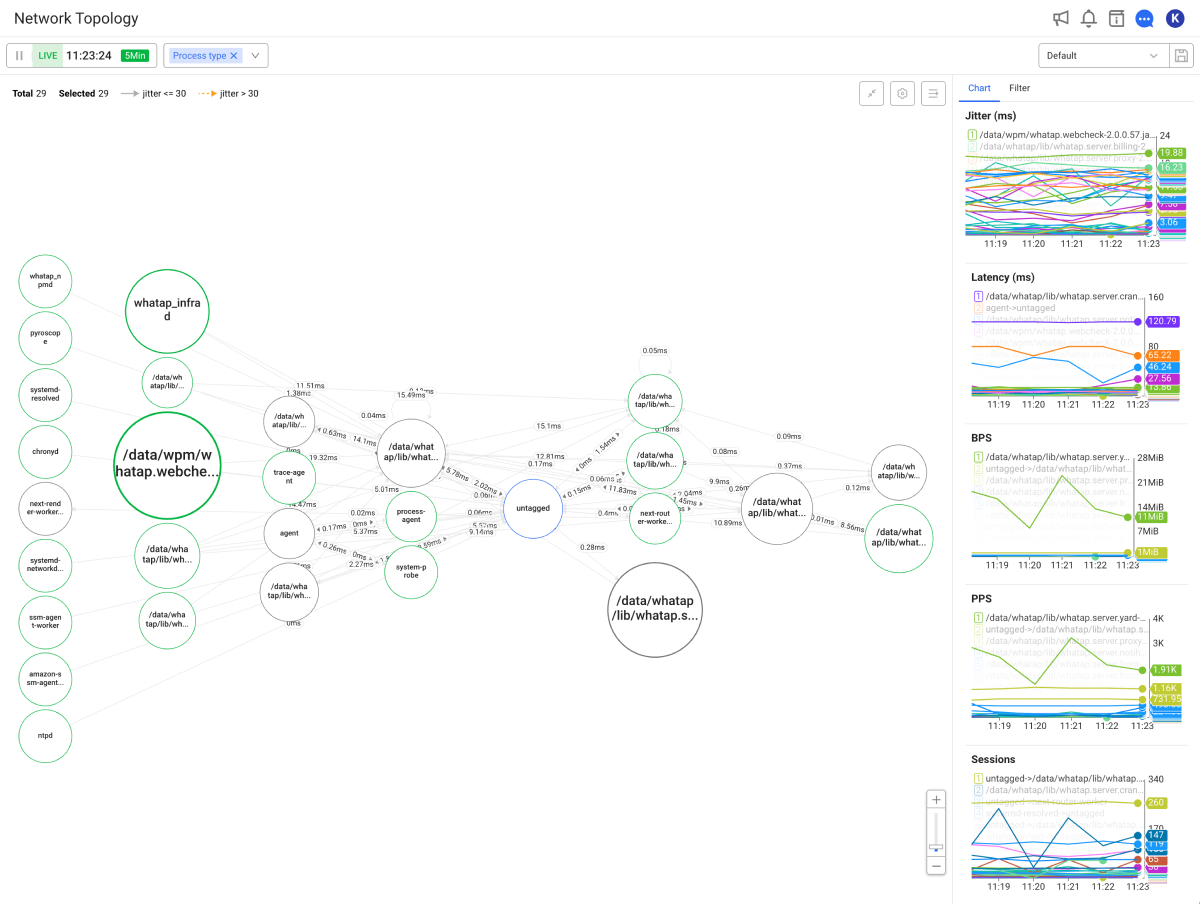
In Network topology, you can see the relationship between nodes at a glance through the topology chart, and quickly see the performances for each network section that relate the line charts for each metric. Real-time and historical data can be viewed, and the performances of abstracted networks can be visualized and monitored based on the process type or application tags.
Basic screen guide
Topology shapes the network with nodes and edges. In parallel with the time series charts for each performance metric, the network bottlenecks or failure sections can be identified more easily.
-
Node is a criterion for expressing the data collected from the monitored servers in group units. This element is expressed as a circle in the chart.
-
Edge means the node-to-node communication. For more information, see the following.
-
You can move the screen to a desired position by clicking and dragging an empty area of the topology chart.
-
You can zoom in or out the topology chart by scrolling the mouse wheel. You can also use the slide tools at the lower right corner.
-
You can move each node by clicking and dragging it to a desired position.
-
Select the
 button on the upper right of the screen to sort the canvas positions so that all nodes are visible on the screen. It is useful for quickly seeing all nodes after filtering tags and repositioning nodes.
 -
Just above the topology chart, you can see the summary information such as the total node count, number of tag-filtered nodes, and threshold settings.

-
To hide the filter panel on the right and zoom in the topology screen, select
 on the right of the chart.
The topology chart options
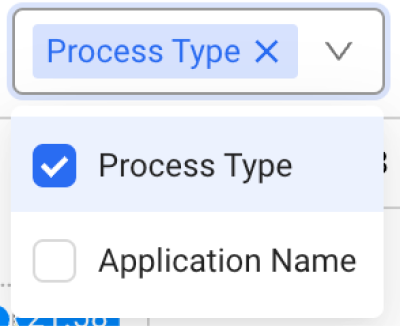
You can view and analyze data by setting what to display on the topology chart. Realtime mode: Searches the data for the time set on the green button in real time. You can click the green button to select a desired time. Click Time setting mode: You can see the data by setting a desired time. Click the green button to select a time from various values. By selecting If you click the text range for date and time, the option appears to select the date and time. To switch to the Realtime mode, select You can select a node type displayed on the chart. Each corresponds to a single tag. Tags are collected depending on the tagRule options you set in the tagRule.yaml file. Nodes can be expressed as Process type and Application name or a combination of the two. For more information about the tagRule options, see the following.Setting the lookup time
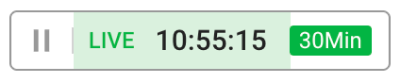
![]() to pause the real-time data search and then search the data for a desired time.
to pause the real-time data search and then search the data for a desired time.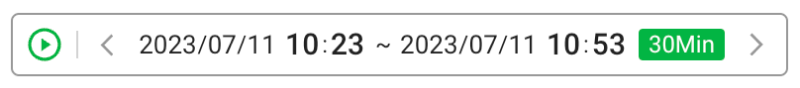
![]() or
or ![]() , you can move by the time set on the green button.
, you can move by the time set on the green button.![]() .
.Selecting a node type
Setting the visual information of the chart
Among the data displayed on the chart, only the required data can be visually exposed. Select ![]() on the upper right of the screen.
on the upper right of the screen.
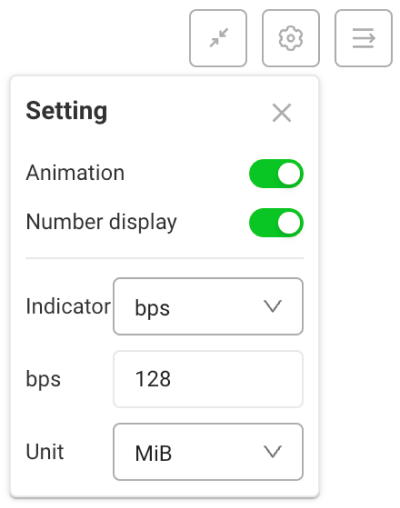
Default options
-
Animation: Set whether or not to display the animation when the threshold is exceeded.
-
Number display: Set whether or not to display the edge labels.
Setting the edge label
Edge means the node-to-node communication and the labels for each edge display the selected performance metrics.

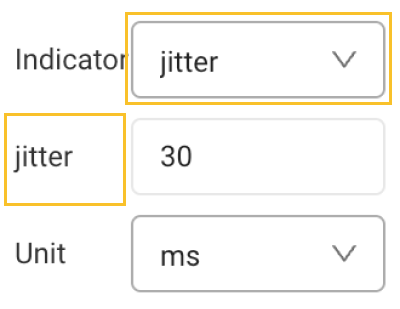
You can select a type of the value to display on the edge of the topology chart. In Indicator, you can select a desired metric. The types of performance metrics that can be displayed on the edge are as follows.
-
jitter
-
latency
-
bps(bit per second)
-
pps(packet per second)
-
sessions
-
In Edge, the second item is also changed according to the selected metric type. In the second item, you can set the thresholds for the selected metric.
-
The weight of the node size is automatically set depending on the value selected in the Indicator item.
Setting the threshold
In the second item and Unit, you can set the thresholds and units for the metric set to Edge. The edges that exceed the threshold are highlighted on the topology.
The thresholds and units are set as follows, unless there is a separate setting procedure.
-
latency > 200 (ms)
-
jitter > 30 (ms)
-
bps > 128 (Mib/s)
-
pps > 50 (K/s)
-
sessions > 100
The settings can be checked in the summary on the upper left of the chart.
![]()
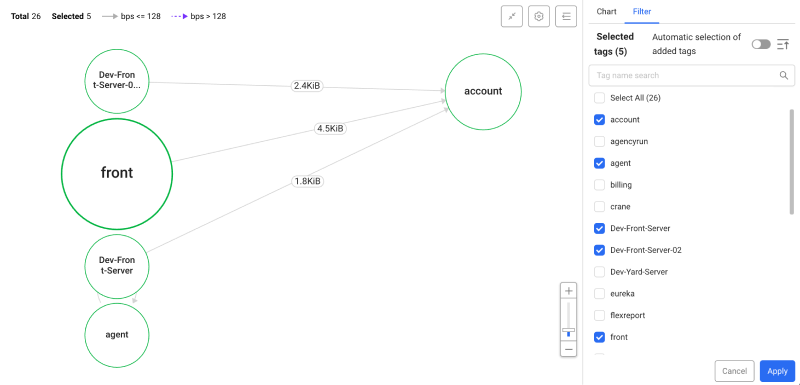
Filtering the tags
If the network configuration is too vast and complicated, you can configure a sub network view by selecting some nodes. In the panel on the right of the screen, select the Filter tab. When the tag list set through the tagRule option appears, select the nodes to display on the screen.

Only the communication performance data between the selected tag nodes and the target node appears on the topology chart. If you exclude the nodes merged by untagged from the topology and time series charts, or there are no nodes for analysis, uncheck them.
The information configured in this way can be saved through the preset function and then recalled for analysis.
-
Only the tags collected during the data lookup period are displayed in the list.
-
To automatically select new added nodes, select the Automatic selection of added tags option.
-
For more information about the preset menu, see the following.
Usage example
To display only some nodes out of all nodes, follow the steps below.
-
In the panel on the right of the screen, select the Filter tab.
-
Release the Select all option and then disable the Automatic selection of added tags option.
-
Select or deselect nodes in the topology chart. You can easily find the desired node by searching for the tag name or using the sorting function (
 ).
). -
At the bottom of the screen, select Apply.
If you select the Select all option and then unselect some nodes, Select all is automatically deselected.
Checking the chart
You can quickly check the performance of the network section by integrating with the line charts for each metric. In the panel on the right, select the Chart tab.
-
The items displayed in the Chart tab are the tags selected in the Filter tab.
-
Hover your mouse over the chart to see the network performance over time.
Preset
Through the preset function, you can save the sub network topology view by relating the tag filter function. If there are too many nodes and edges in the topology view, it is recommended to divide and filter the network part and save it as a preset for analysis.
The data saved in the preset is as follows.
-
Node display type
-
Edge display type
-
Threshold value
-
Tag filter
-
Positions for each tag on the topology
Creating a preset
-
Set the topology chart options as you want.
-
On the upper right of the screen, select
 .
. -
When the Save preset window appears, enter the name of the preset to save.
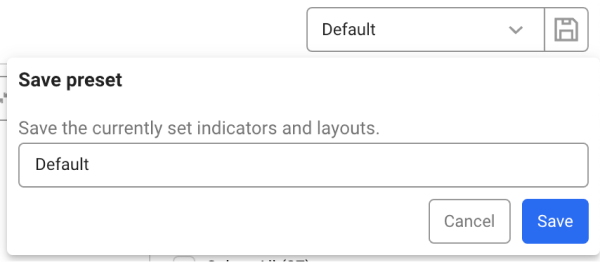
-
After entering the preset name, select Save.
Modifying a preset
With a preset selected, modify the options of the topology chart. To update the current preset, save it with the same name as the previous preset.
You can also save the preset with another name.
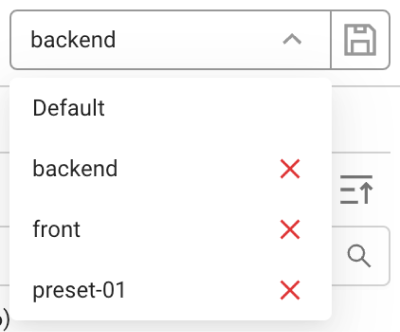
Deleting presets
To delete unused presets, select ![]() in the preset list.
in the preset list.