Metrics Cube
Home > Select Project > Metrics > Metrics Cube
Metrics Cube provides the trend analysis of metrics field data for each category. You can see the metrics field data through the chart of square widgets as follows.
Selecting a category
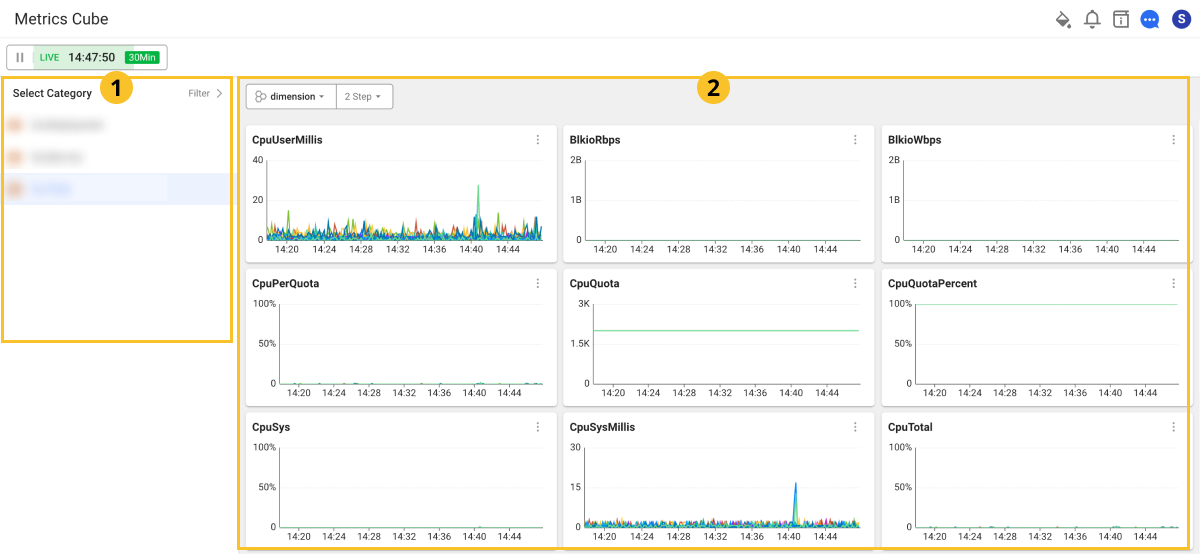
The Select Category function is provided in the ![]() area on the left of Metrics Cube. Search the category list and select a category in
area on the left of Metrics Cube. Search the category list and select a category in ![]() . You can configure your dashboard in the
. You can configure your dashboard in the ![]() chart widget area with the fields contained in the selected category.
chart widget area with the fields contained in the selected category.
Filtering
It provides tag-based filtering in the ![]() area on the left of the Metrics Cube screen. At the top of
area on the left of the Metrics Cube screen. At the top of ![]() , select FILTER to display the filter list as follows.
, select FILTER to display the filter list as follows.
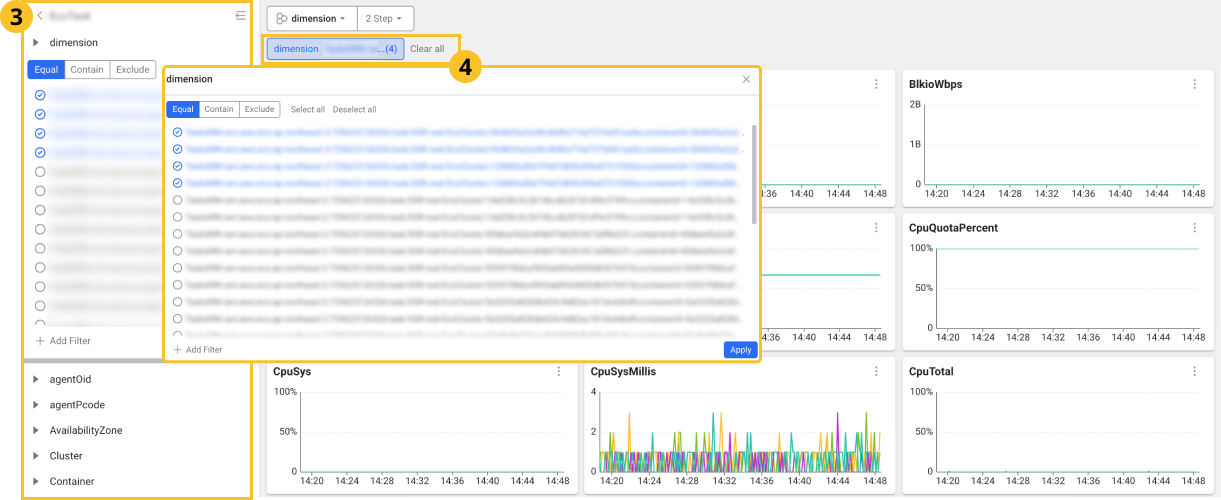
In the ![]() filter list, you can set the filtering criteria such as Equal, Includes, Excludes, Select All, and Deselect All. You can add a filter by selecting + Add Filter. Select Apply to apply the setting and then configure the dashboard in the
filter list, you can set the filtering criteria such as Equal, Includes, Excludes, Select All, and Deselect All. You can add a filter by selecting + Add Filter. Select Apply to apply the setting and then configure the dashboard in the ![]() chart widget area.
chart widget area.
At the top of the filter list, select the ![]() icon to return to the category list. If you select the
icon to return to the category list. If you select the ![]() icon, the filter list is hidden and the dashboard area is expanded to focus on the chart.
icon, the filter list is hidden and the dashboard area is expanded to focus on the chart.
You can select an applied filter in the filter list on the left and at the top of the ![]() area to modify on the
area to modify on the ![]() screen.
screen.
Grouping
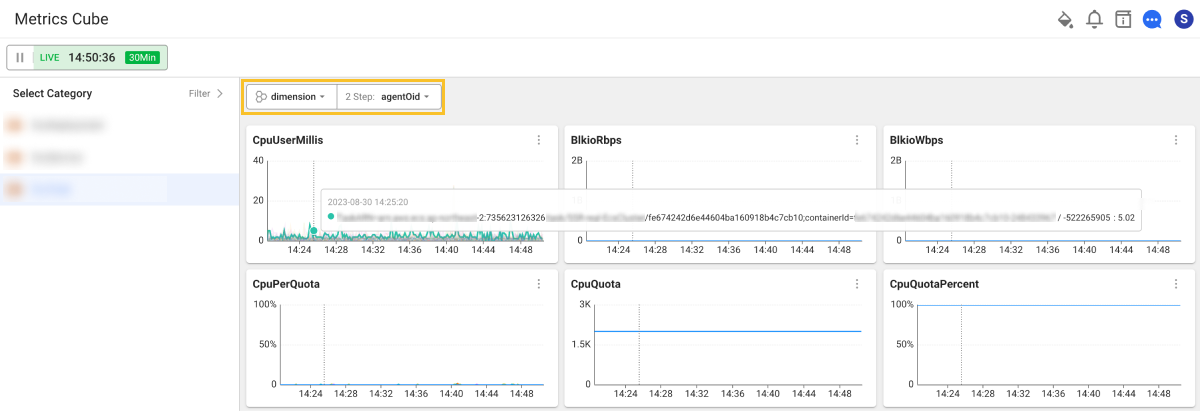
It provides the tag-based grouping. You can modify the chart data grouping through the grouping options at the top of the ![]() area on the right of the Metrics Cube screen. Two levels of grouping is provided. By selecting Step 2, you can set the tags for grouping. In the following example, two-level grouping is applied using the reference properties of
area on the right of the Metrics Cube screen. Two levels of grouping is provided. By selecting Step 2, you can set the tags for grouping. In the following example, two-level grouping is applied using the reference properties of dimension and agentOid as tags.