Metrics Chart
Home > Select Project > Metrics > Metrics Chart
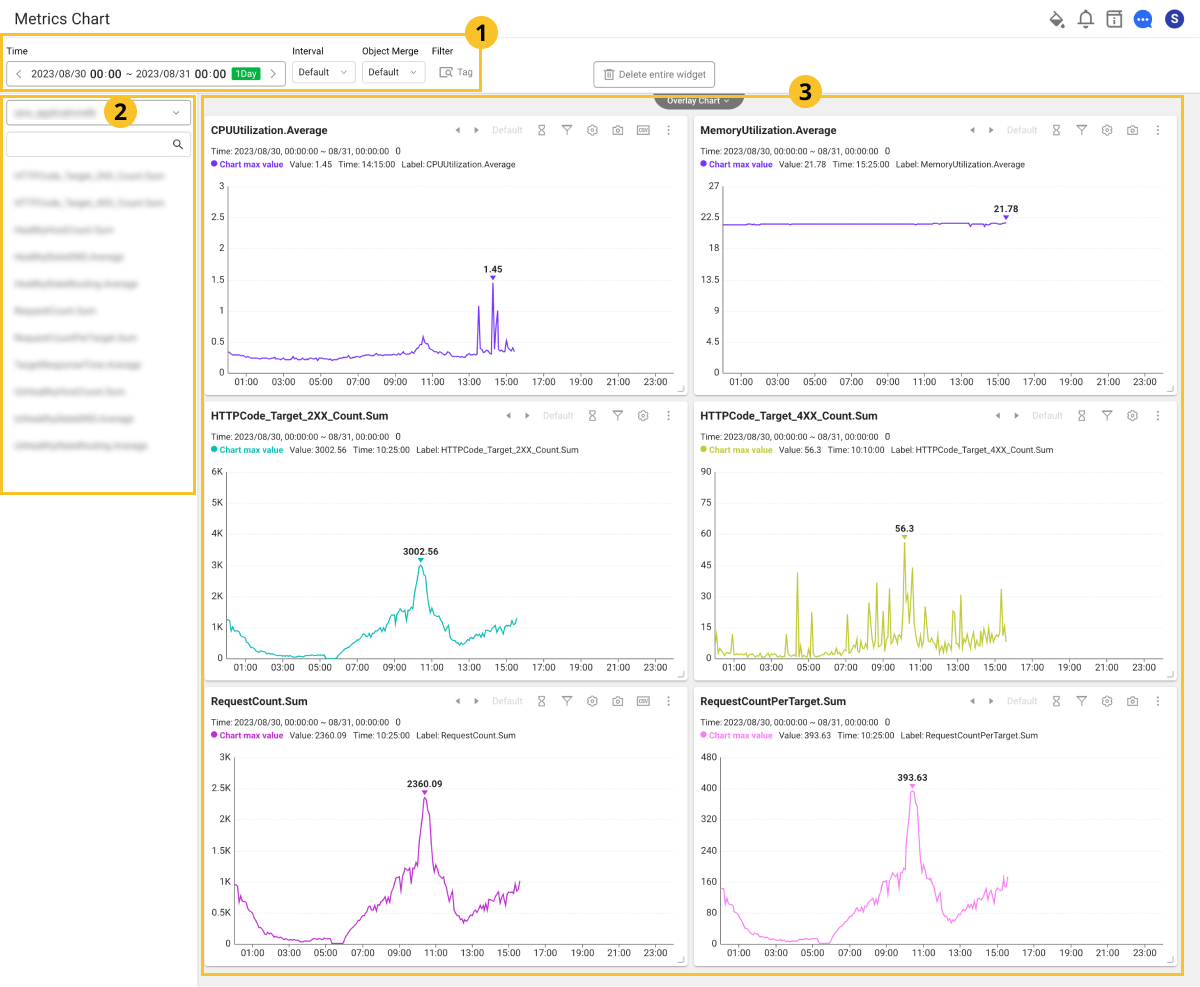
Metric Chart provides a single metric lookup function. You can see the metrics data as a chart as follows.
Options at the top
In ![]() , you can specify the time range of the chart (X-axis) through the options at the top of Metrics Chart.
, you can specify the time range of the chart (X-axis) through the options at the top of Metrics Chart.
-
Time: You can specify the start and end of the X-axis as the total range in time.
-
Interval: You can specify the X-axis data interval as the time interval.
-
Object Merge: You can group the chart data by merging the data that has the same tags among data with different field values.
-
Filter: You can filter data by specifying tags.
Metrics list
The ![]() area is a list of metrics to query for options. Select a metric. Based on the data within the time range specified in the top menu of the
area is a list of metrics to query for options. Select a metric. Based on the data within the time range specified in the top menu of the ![]() area, you can see the chart in the
area, you can see the chart in the ![]() area.
area.
The configuration of the time and metric is required.
Chart widget
On the top left of ![]() , you can see the metric name. On the top right of the chart widget, you can see the following options:
, you can see the metric name. On the top right of the chart widget, you can see the following options:
![]()
-
Time movement:

 Using the left arrow button or right arrow button, it can be moved by -1 or +1 as much as the selected time range.
For example, if the time range is between 00:00 on February 13 and 00:00 on February 14, when you select the
left arrow button, you can see the data within the time range between 00:00 on February 12 and 00:00 on February 13. -
Interval/Object Merge: In the menu at the top of
 , you can modify the specified interval and time merge.
 -
Time comparison: If you select
 , you can compare the current trend of the same metric with that of the previous time zone.
 -
By selecting the monitoring target:
 , you can specify the monitoring targets. If not selected, it searches for all.
 -
By selecting the snapshot:
 icon, you can snapshot charts except for widget options.
 -
By selecting the Display Detail:
 icon, the detailed view can be seen. When there are many monitoring targets, you can see the metrics trends for each monitoring target individually.
 -
By selecting the CSV:
 icon, you can download the plot data on the chart as a CSV file.
If you do not see any options at the top of the metrics chart widget, select the ![]() icon.
icon.
Deleting a widget
To delete all widgets placed on the screen, select ![]() Delete entire widget on the screen.
Delete entire widget on the screen.