Managing the widgets
You can customize your dashboard by handling the widgets placed on the Flex board.
Adding a widget
You can add any widget to the created Flex board.
-
In Dashboard list of Flex Board, select a dashboard to add the widget.
-
On the upper left of the screen, select Edit Mode.
-
Select a desired widget from the Widget templates list on the left. To add a metrics widget, select All metrics and then click a desired widget.
- If you have entered Integrated Flex Board on the Home screen and added a widget, click Project selection and then select target projects to collect.
- If you have more widgets to add, repeat the same procedure.
After all steps are finished, select View mode to check the layout and then select ![]() (Go to list).
(Go to list).
Changing the widget attributes
In Dashboard list of Flex Board, select a board to change the widget properties. It goes to Edit Mode.
Changing the widget name
On the right of the widget name to change, select ![]() . Set the widget values for Title, Font size, and Color, and then select Save.
. Set the widget values for Title, Font size, and Color, and then select Save.
-
If the Apply to the entire widget toggle button is enabled, the font size and color are applied to other widgets.
-
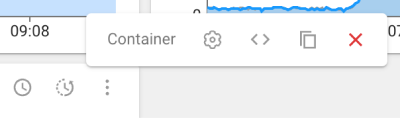
To lock the widget title, select Configuration icon and then click Save.
Time Setting
On the upper right of the widget to set the time, select ![]() . The Select a time window appears.
. The Select a time window appears.
-
To apply the set time to the dashboard, check Use dashboard settings. The time setting on the dashboard is located on the upper right.
-
To apply a desired time setting, uncheck Use dashboard settings. Use
 or
or  to set the desired time.
After setting the time, select ![]() .
.
Depending on the data type of the widget, the time setting may not be available.
Setting the output data options
By setting the output data options of the chart widget, you can select the desired data. On the upper right of the widget, select ![]() .
.
-
You can filter data by selecting types for project, agent, application, etc.
-
You can change the type of the graph displayed on the chart by selecting individual or merged data.
-
Select
 >
>  . You can change the option details through the Chart settings window. The options that can be set are as follows.
-
Chart type: This option allows you to display the current aggregated figures on the chart.
-
y axis Chart max value: The chart maximum value on the Y axis can be selected with one of Auto and Fix.
-
Set horizontal line: Select Add to display the threshold or range as a horizontal line. You can apply multiple items added. After adding the horizontal line, select Apply to apply it to the chart.
-
Show chart max value: The maximum value of the graph is displayed on the chart.
-
Sub-chart: You can add a sub-chart to the main charts of the widget. Select a type of sub-chart and then select its layout, size, and whether or not to merge data. To apply to other widgets, select Apply to the entire widget. Sub-charts are useful to view data in various ways.
After setting all options, on the left of the Chart settings window, click
 or click the outside of the Chart settings window.
 -
Depending on the widget's data type, available options may differ.
Changing the metrics widget data
You can change the data query conditions of the metrics widget.
-
In Flex Board > Edit Mode, on the upper right of the widget to change, select
.
-
Select
 . The data setting edition window appears.
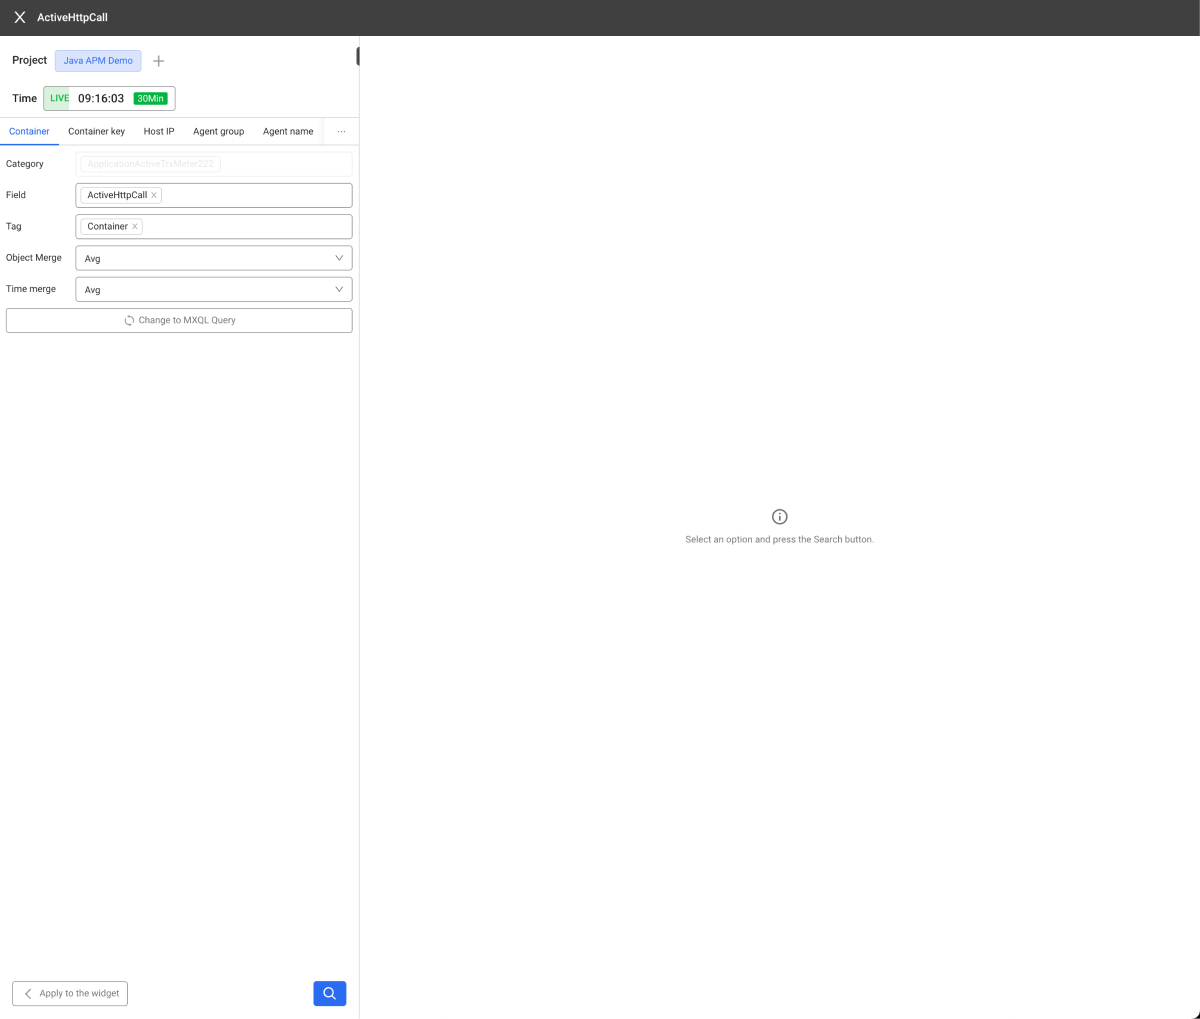
-
Change the settings referencing the following, and then select
Apply to the widget.-
Metrics options that are created by default when creating a widget appear on the tab.
-
Metrics options are Category, Field, and Tag.
-
The Category currently restricts the editing function.
-
In Field and Tag, multiple items can be selected. The chart data is grouped using the selected tag options.
-
Select
 to query the original data.
 -
For more information aboutObject Merge and Time merge, see the Data merge options.
-
Data merge options
The metrics widget placed on the All metrics list of the Flex board provides the data merge options.
-
In Edit Mode, select All metrics and then change the Widget templates list to the All metrics list.
-
Place the metrics widget on the layout.
-
On the upper right of the metrics widget, select
. -
If a tag (e.g. agent name) option is selected, the data merge options appear. Depending on the widget size, the metrics option's location may differ.
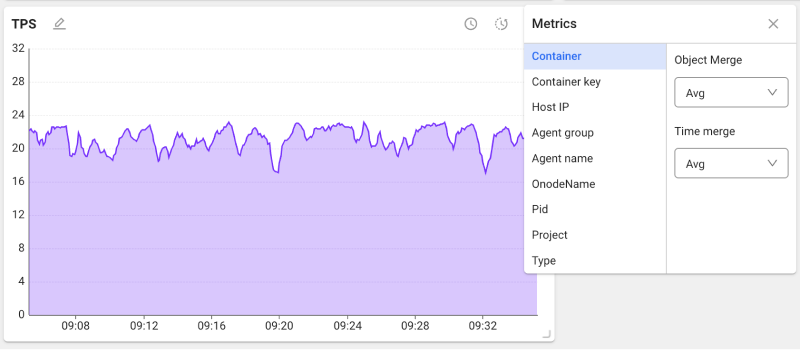
Data merge provides the following methods: Object Merge and Time merge.
-
Object Merge
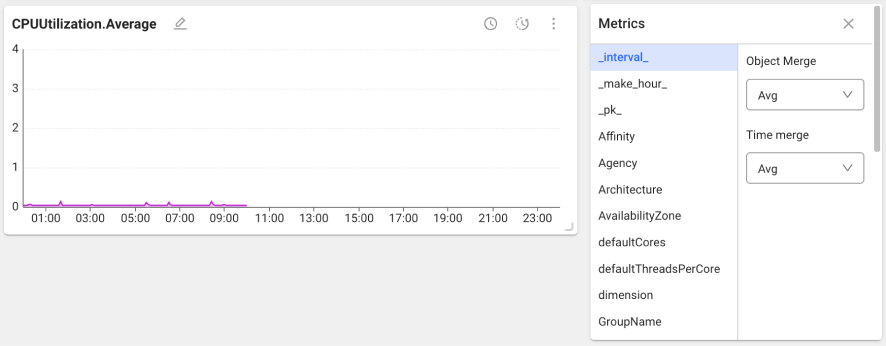
It is used to group the chart data based on the tag (e.g. agent name) selected on the left. At this time, if the tags match among the data with different fields (e.g. CPU), the corresponding data is merged.
-
Time merge
It is mainly used if the lookup time is too long. Data with the same fields in the original data are merged at regular time intervals (5 minutes or 1 hour) depending on the time range. This method is called "Time Merge."
-
AWS ColudWatch Metrics
In case of AWS monitoring metrics, the statistical method is added after the field name in the form of suffix. Data merging defaults reference this suffix.
Copying a widget
- Select on the upper right of the widget.
- Select
 .
. - If the Copy window appears, select Add widget.
- Change the widget name in the list.
- Select Apply.
In Edit Mode, you can see the copied widget.
Delete Widget
- Select on the upper right of the widget.
- Select
 .
. - If the confirmation message appears, select Delete. To cancel the deletion, select Cancel.