Slow Query
Home > Select Project > Dashboard > Slow Query
It reads the slow query logs from the database and display them as a visual chart. The reference time for a slow query is set in a DB parameter, and the SQL in the slow query log is displayed.
Even for the same SQL, in case of the SQL Elapse Map metric in Monitoring Multiple Instances, an error may occur because the time is calculated based on active sessions.
Guide on how to use
To use the Slow Query menu, set parameters and roles as follows.
Configuration of the DBX agent file
slow_query_log=ON
Configuring the DB parameters and roles
slow_query_log = 1
long_query_time = 3 # e.g. Recording for SQLs taking 3 seconds or more
log_output=FILE # or TABLE
-
If you set the
log_output=FILEoption on the DB server, xos installation is required. For more information, see the following. -
If you are using AWS RDS and set the
log_output=FILEoption, configure the settings to use CloudWatch instead of xos installation. For more information, see the following. -
If you use other clouds, set the
log_output=TABLEoption to use the Slow query menu. However, in the environments where many slow queries occur, caution is required because the DB performance may decrease when viewing mysql.slow_log. -
If you set the
log_output=TABLEoption, assign the lookup role to the monitoring account. Execute the following command.grant select on mysql.slow_log to whatap;
XOS agent configuration of the DB server
Set as follows to adjust the collection cycle for slow queries.
slow_query_interval = 30 # Default 30 seconds
To monitor slow queries, be sure to install the XOS agent on the DB server. For more information about the XOS agent installation, see the following.
Basic screen guide
-
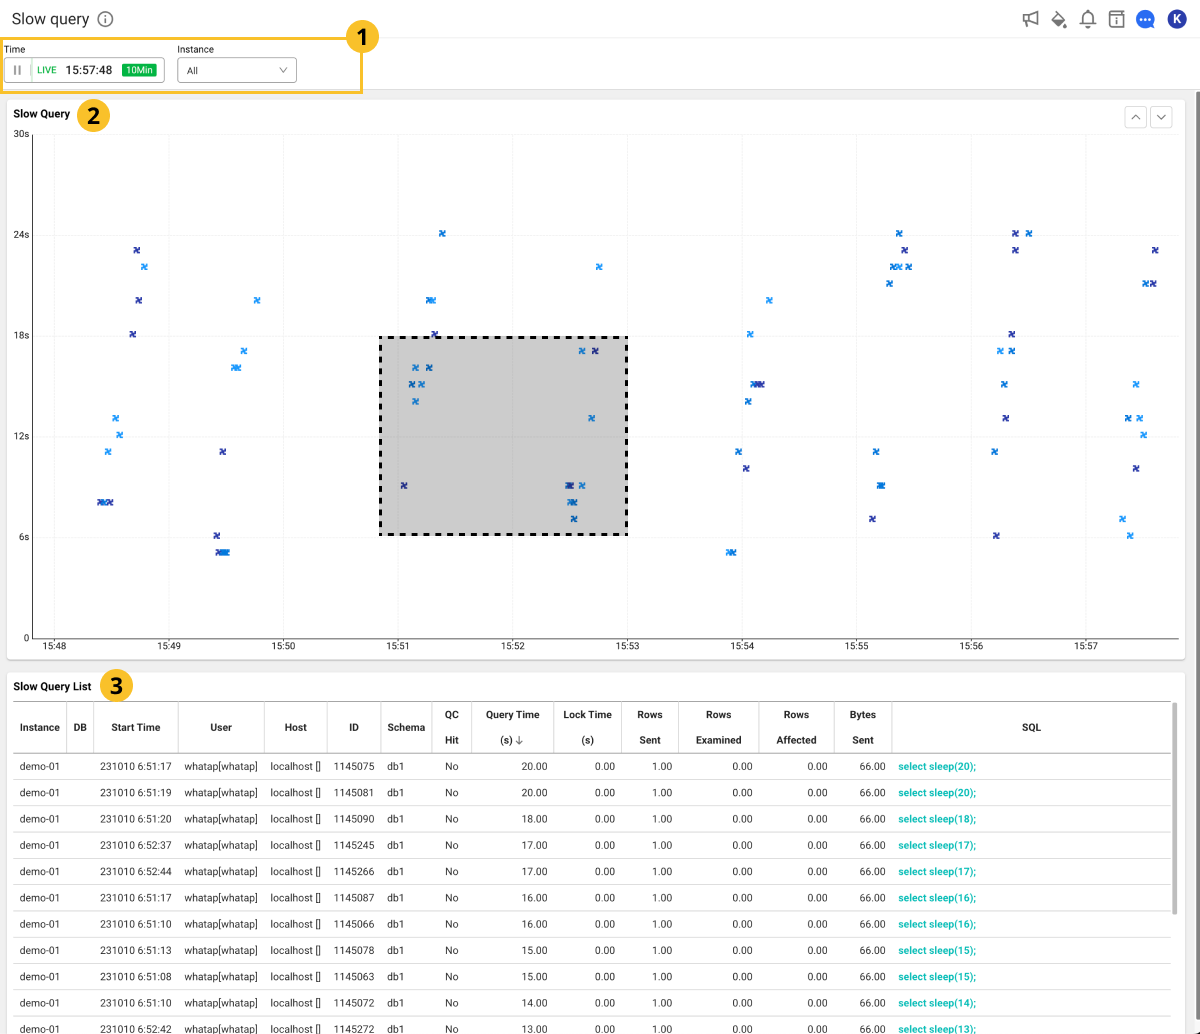
 Time / Instance
You can change the duration of an active session or select individual instances.
-
 Slow Query
It displays the times of slow queries with a chart. If you drag a specific area with you mouse, you can see information details in Leader line 3 Slow Query List.
-
 Slow Query List
The slow query details on the area dragged on the Slow Query chart are displayed in the list. If SQL is selected, you can see the (query)'s full text and plan information.
See query details
To check the SQL query information of the current running session, select the SQL column in the Slow Query List section. The SQL details window appears. You can check the SQL query statements and plan information.
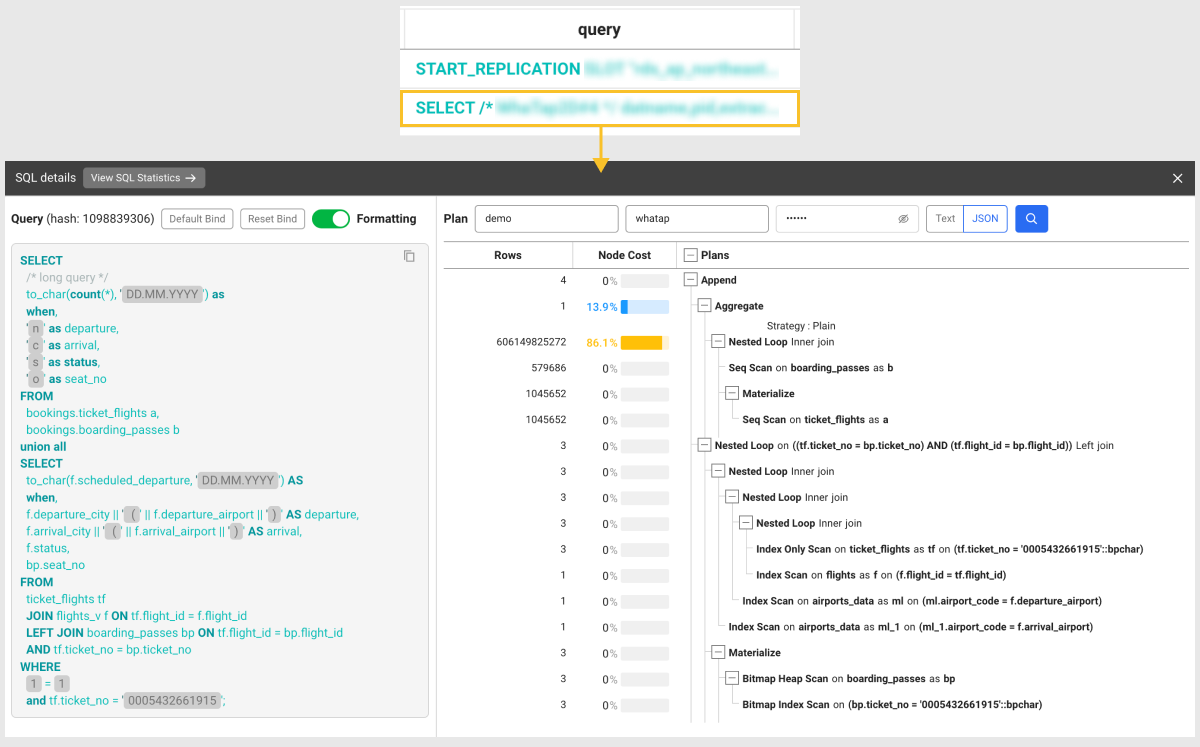
- View SQL Statistics: You can go to the SQL statistics menu where you can check statistical information related to the SQL query statement.
-
Default Bind: You can bind the part set as a variable in the query sentence to the default value.
-
Reset Bind: You can release the bound default value and check the variable.
-
Formatting: You can improve readability by applying indentation and formatting to a SQL query statement.
-
Plan: To check plan information, enter DB Name, User Name, and Password, and then select
 .
.-
Text: You can check plan information in text format.
-
JSON: By viewing the plan information in Json format, you can quickly find the points where bottlenecks occur.
NoteThe function to view plan information in JSON format is supported only in DBX agent 1.6.15 or later.
-
If you select a table or index while viewing the plan information in JSON format, the Object detail window appears where you can see the configurations for columns and index items in the table.
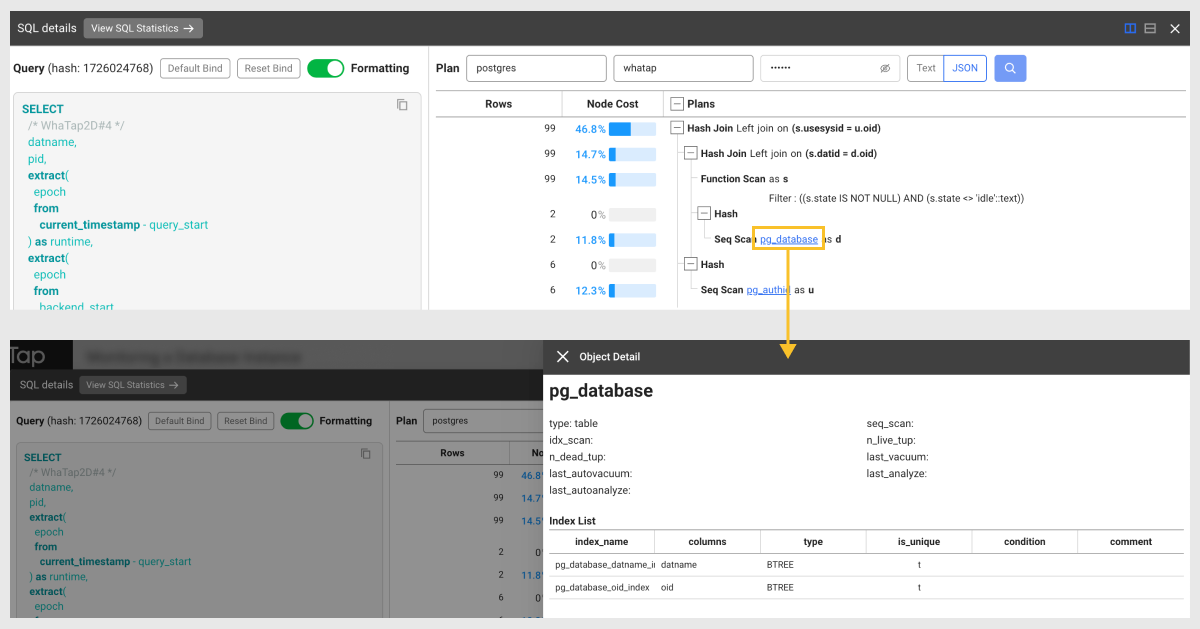
This function is supported in DBX agent 1.6.15 or later. For more information about the database roles and related settings, see the following.