Correlated project management
Home > Select Project > Management > Correlated Project Management
If you have created a database monitoring (DPM) project and an application monitoring (APM) project, you can relate the two projects for monitoring the data collected from DPM in the APM project.
You can check the details of the transaction in real time through active transactions of the application linked to the active session in the database. This integrated monitoring allows you to analyze the interactions between applications and databases in detail and diagnose and resolve performance bottlenecks in real time.
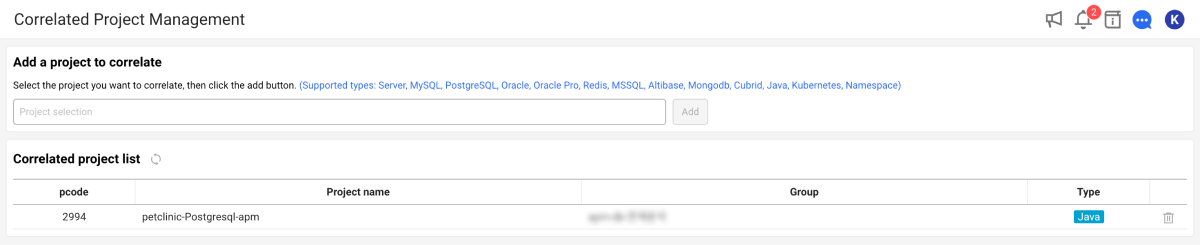
The Correlated Project Management feature allows you to go beyond product-/equipment-centric monitoring and view monitoring data across multiple projects. This is useful for analyzing how different system components such as applications and databases, interact together. In particular, when performance degradation occurs, you can quickly determine whether it is a hardware problem or an individual application problem, which can significantly reduce the troubleshooting time. Through Correlated Project Management, you can comprehensively analyze performance data at the user system level and obtain more visible insights.
Through the following video clip, see the content details.
Notes before you begin
-
Currently, only the Java platform is supported. The supported platforms are to be expanded through upcoming updates.
-
The Correlated DB session feature requires Java agent 2.2.33 or later.
-
For more information on how to link a database project to the application project, see the following.
Prerequisites
To use correlation analysis, prepare the database privilege, the APM agent options, and the project link in that order. Even after you link the projects, the Correlations icon does not appear in the active session if either of the first two is missing.
APM agent options
Set the following options in the whatap.conf file of the APM project. You can also set them in Management > Agent CONF..
dbc_sid_enabled=true
hook_db_native_enabled=true
| Option | Default | Setting | Required | Description |
|---|---|---|---|---|
dbc_sid_enabled | false | true | Required | Issues the SID that serves as the key for correlation analysis |
hook_db_native_enabled | false | true | Required | Extracts the database type that the transaction uses |
debug_dbc_sid_enabled | false | true | Optional | Records SID information in the Java agent log. Use it to find the cause when the correlation does not work |
Set both options and then restart the application. The option that requires the restart is hook_db_native_enabled. dbc_sid_enabled takes effect without a restart.
Requirements
| Item | Condition |
|---|---|
| APM agent | Java agent 2.2.33 or later. Only the Java platform is supported |
| Databases supported for correlated projects | PostgreSQL, Oracle, MySQL, SQL Server, CUBRID, Altibase, Redis, MongoDB |
| Databases supported for correlated DB sessions | PostgreSQL, Oracle, Oracle Pro, MySQL |
| Console permission | Project edit permission |
| Query condition | Real-time query state |
When the Correlations icon does not appear
If the Correlations icon does not appear in the active session even after you link the projects, check the following.
-
Check that both
dbc_sid_enabledandhook_db_native_enabledaretrueand that you restarted the application after changing the values. -
Check that the Java agent of the linked APM project is 2.2.33 or later.
-
Check that the database in use is on the list of databases supported for correlated DB sessions.
-
Check that you are in the real-time query state. The Correlations icon does not appear when you query a past time range.
-
Check that the active session collection filter options are not filtering out the session. The Correlations icon does not appear if
limit_active_sessioncaps the number of collected sessions or ifskip_userorskip_sys_sessionexcludes the account. -
Set
debug_dbc_sid_enabled=trueand then check in the Java agent log whether the SID is issued.
Adding any linked project
-
Go to Management > Correlated Project Management.
-
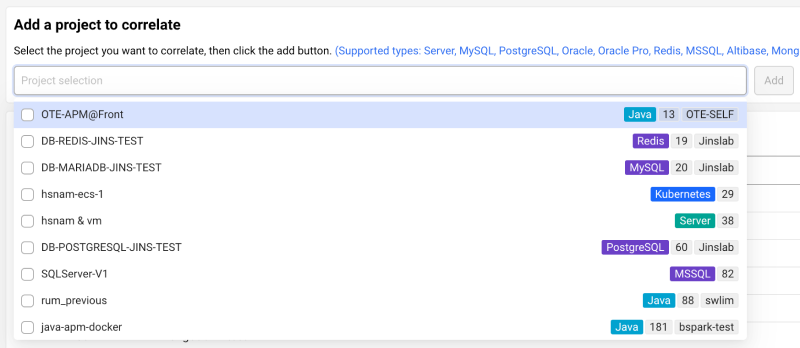
In the Add a project to correlate section, select the Project selection input field.
-
If you see a list of projects, select a project to link to. You can also enter a string to search for matching projects.
-
Select one or more projects and then select Add that is active.
The selected project is added in Correlated project list.
You need the Edit role on the project to add a linked project. If you have the Edit role, the Add button is enabled in the Correlated Project Management menu.
Checking any linked project
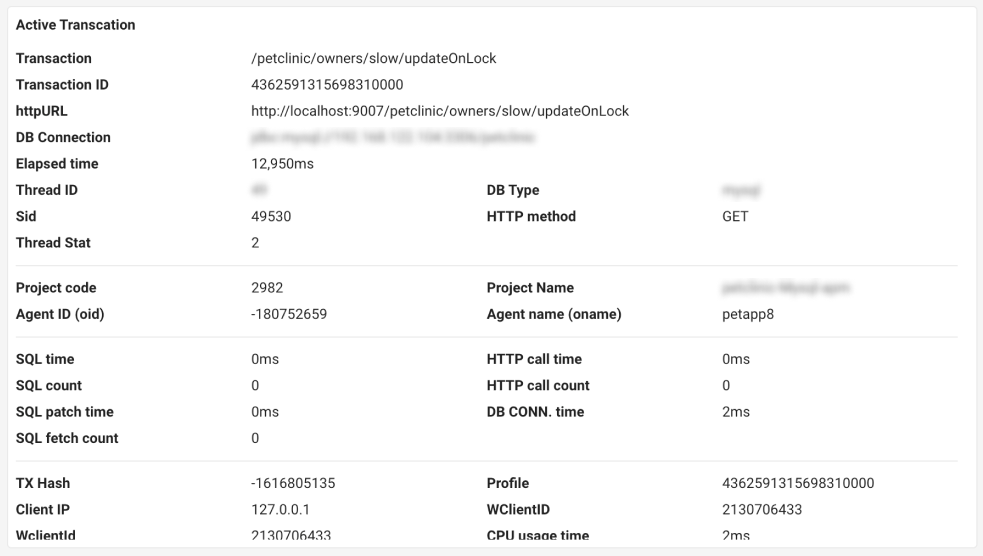
You can see real-time details about the active transactions of applications linked to active sessions in the database. Basic information such as the transaction URL, database connection information, DB type, HTTP method, and execution time appears together with metrics such as the transaction ID, thread ID, client IP, and CPU usage time. You can also check the SQL query execution time, the number of SQL calls, and the DB connection time.
Call stack information and SQL queries are provided together. When a problem occurs, you can trace its cause in detail and quickly find where the performance bottleneck is between the application and the database.
Tracing active transactions
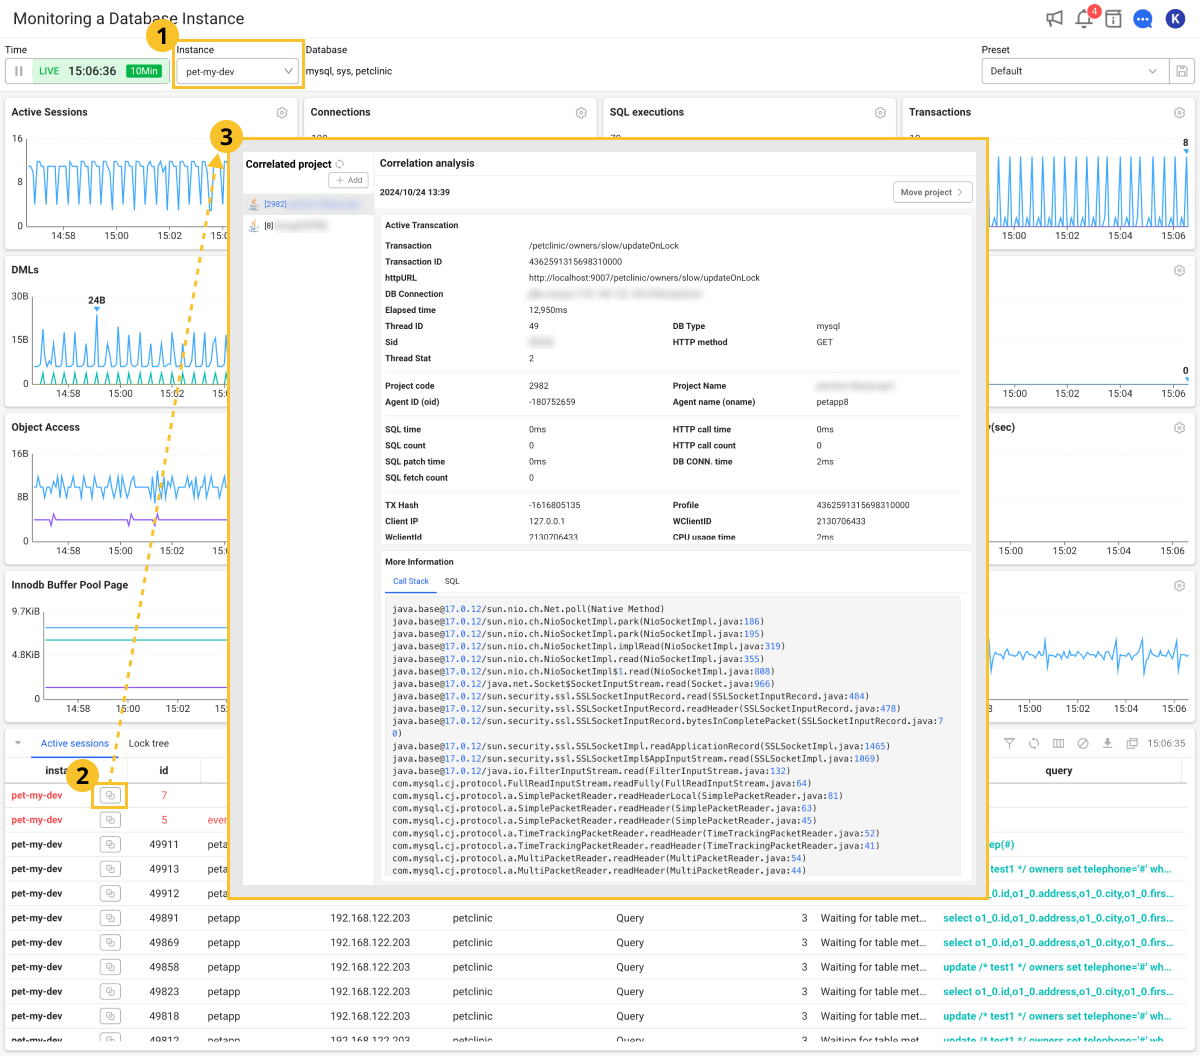
Go to Dashboard > Monitoring a Database Instance. The link analysis feature can be checked only in real-time query status.
-
Select an instance (agent) for query in the Instance option.
-
In the Active sessions table list, select
 for the active session to correlate.
 -
The Correlation analysis window appears, which provides transaction information associated with the selected active session.
Select the desired project from the Correlated project list to check the linked analysis information.
-
You can go to the Application Dashboard menu for that project by selecting Move project on the upper right of the screen.
-
If there is no transaction associated with the selected active session, the screen displays No data.
Correlation analysis Screen guidance
The Correlation analysis window displays information details for active transactions, as well as the call stack and SQL statements.
Active Transaction
You can check information details of the linked active transactions.
-
DB Connection: Database connection URL.
-
Thread ID: Unique identifier of the thread used to process the transaction.
-
Sid: ID of the selected active session.
-
Thread Stat: Current status of the thread.
-
DB Type*: Type of the linked database platform.
-
In the versions before Java Agent 2.2.40, the ThreadStat value appears in numeric format. To display in text format, install Java Agent 2.2.40 or later in the related projects.
-
For more information about others, see the following.
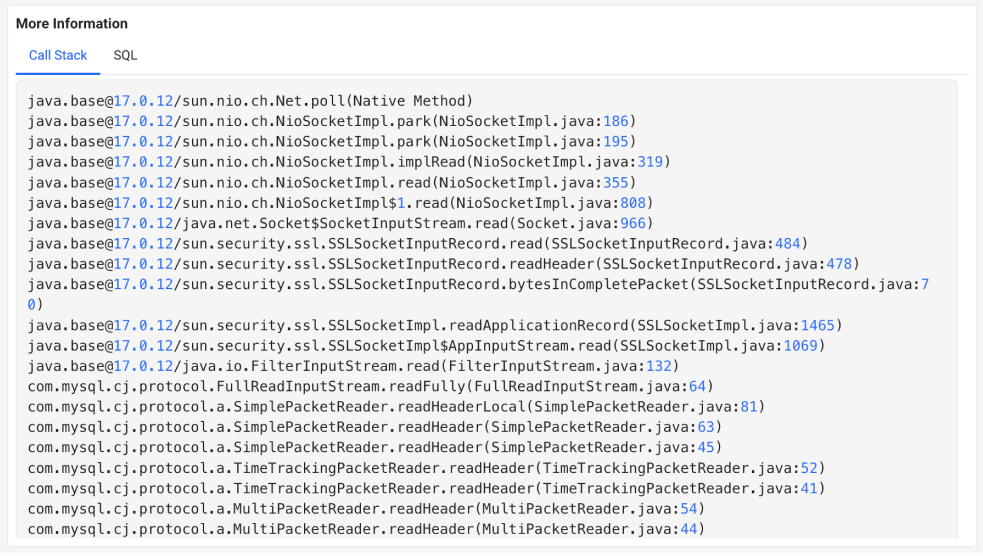
Call Stack
It provides information to trace the order of methods or function calls.
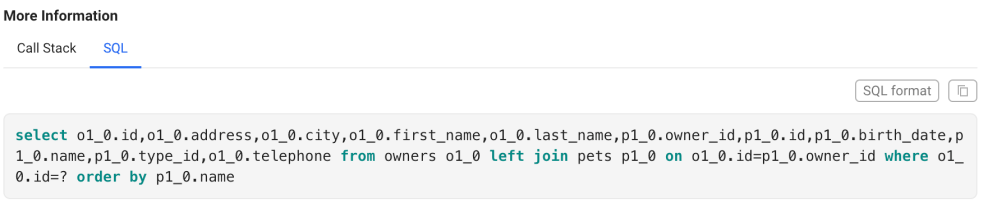
SQL
SQL query executed via the linked active transactions.
Removing any linked project
-
Go to Management > Correlated Project Management.
-
To delete a project to unlink from the Correlated project list section, select
 on the utmost right of the list.
 -
When the confirmation message appears, select Delete.
The deleted project is excluded from the Correlated project list section.