Lock Tree & Dead Lock
You can analyze the trend of locks during the day. The session that caused a lock (Lock Holder) and the session waiting for a lock (Lock Waiter) can be checked through a tree structure. Through these functions, you can analyze queries by checking the relationship between holders and waiters for locks that occurred at specific points.
Lock tree
Home > Select Project > Analysis > Lock Tree
It provides the time series chart and lock tree for the locks occurred during the day. From the point where a lock first occurred, the structure of holders and waiters is displayed in a tree form. You can check the rock tree over time.
Basic usage guide
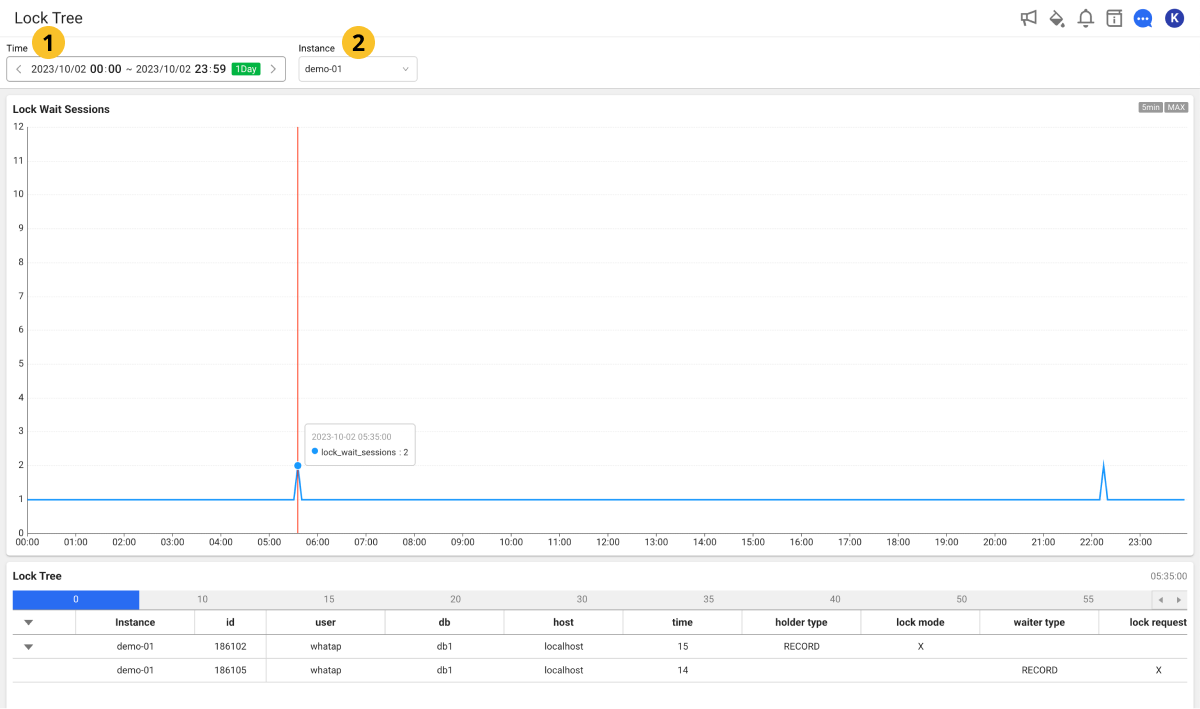
Select the desired date, time, and instance to view in ![]() Time and
Time and ![]() Instance. If a lock occurs at the set time, the searched data appears in Lock Wait Sessions and the Lock Tree table at the bottom of the screen.
Instance. If a lock occurs at the set time, the searched data appears in Lock Wait Sessions and the Lock Tree table at the bottom of the screen.
-
You can see the data for up to two weeks within a chart. If you click a specific time in the graph chart, you can check the lock information for the selected time in the table at the bottom of the screen. If you select the button in seconds, you can view the lock information in 5-second increments.
NoteThrough the tags on the upper right of the Lock Wait Sessions chart, you can see the units to view.
-
As you continuously drag (drill down) a specific time zone on the graph chart, you can see the charts and lock trees for detailed time zones.
-
You can see the data in 5-second increments by dragging within 3 hours on the chart. However, the data in 5-second increments can only be viewed within the most recent month. The data earlier than one month can only be viewed as 5-minute summary data. For example, you can drag (drill down) lock tree data from 40 days ago for the 5-minute summary data, but you cannot see 5-second data.
For more information on how to use the Time option, see the following.
- Active session
- Lock tree
- Process information
| Item | Description |
|---|---|
Instance Name | Instance Name |
id | Connection identifier |
user | SQL execution account |
host | Hostname that this thread is connected to. |
db | Default database name. If nothing, it is NULL. |
command | Running command type (Query/Sleep/Daemon, etc.) |
time | Execution time of the current command (sec) |
state | Current thread status (executing, updating, sending data, etc.) |
query | Running statement. It displays the literal value SQL separated from Processlist.info. |
query_param | Literal value separated from query |
type | Thread type. FOREGROUND/BACKGROUND, etc. |
connection_type | The protocol used to establish a connection. TCP/IP, SSL/TLS |
| Item | Description |
|---|---|
holder type | Type of the holder session |
lock mode | holder_mode |
waiter type | Type of the waiter session |
lock request | waiter_mode |
state | This is the step where the current process is in progress. |
table | holder_table/waiter_table |
index | holder_index/waiter_index |
The following items are the metrics collected if the XOS agent has been installed.
| Item | Description |
|---|---|
cputime | CPU usage time |
cpuusage | CPU Utilization |
elapse | Elapsed time of CPU usage |
vsize | Virtual memory size (Kb) |
rss | Resident Set Size (RSS) that is the number of physical pages associated with the process. |
state | Process status |
ioread | Actual time spent reading the block (milliseconds) |
iowrite | Actual time spent writing the block (milliseconds) |
pss | Process specific memory usage + Percentage of shared memory occupied by one process |
uid | user id |
cmd | Executing command |
longcmd | Full path of cmd |
Dead lock
Home > Select Project > Analysis > Dead Lock
A deadlock occurs when multiple processes or transactions block each other from processing by locking database resources (tables or rows). Frequent deadlocks cause inconvenience to end users and reduce the service quality. In the Dead Lock menu, you can see the time and related data when the deadlock occurred. This information can help you identify and solve problems in the application design.
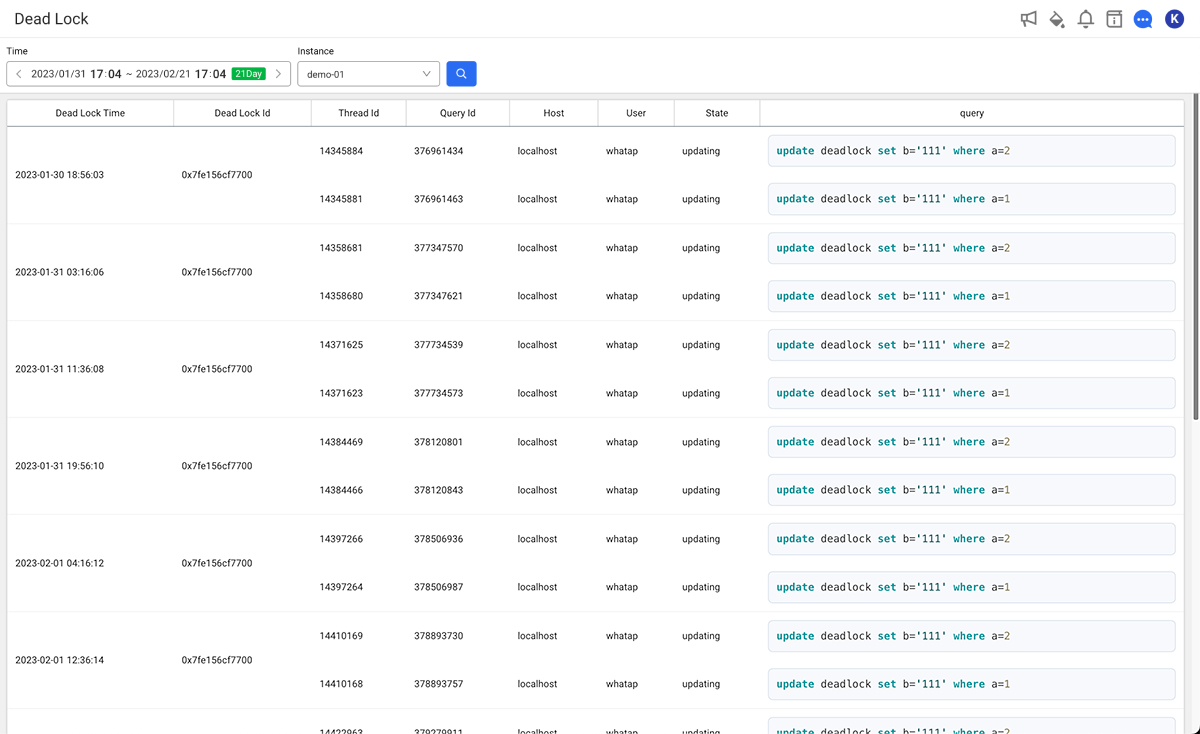
You can check information about deadlocks that have occurred in the database.
-
Set the time to search in Time.
-
Select an instance name to view in Instance.
-
Select
 .
.
It provides deadlock information in the form of table.
-
The query time can be set up to 3 weeks.
-
For more information on how to use the Time option, see the following.