Procedure statistics
Home > Select Project > Stat/Report > Procedure statistics
It provides performance-related information such as number of executions, total execution time, logical/physical reads and writes for stored procedures registered in the SQL Server. This allows you to monitor the usage and performance for stored procedures and identify them for optimization.
-
You can analyze the number of executions and total execution time to identify which procedures are having the most usage.
-
I/O performance bottlenecks are detected and optimization targets are identified through logical/physical data for read operations.
-
You can identify resource-intensive queries by checking the execution data of queries inside the procedure.
-
You can identify inefficient queries by comparing total execution time and CPU usage time.
Stored procedures are a set of pre-written SQL commands to perform specific tasks in the SQL Server. They are reusable and parameterized dynamic operations can be performed. It is beneficial for code management and performance enhancement. For more information, see the following link.
Basic usage guide
-
Select the time and date to view data in Time.
-
Select a target to view data in Instance.
-
Select
.
-
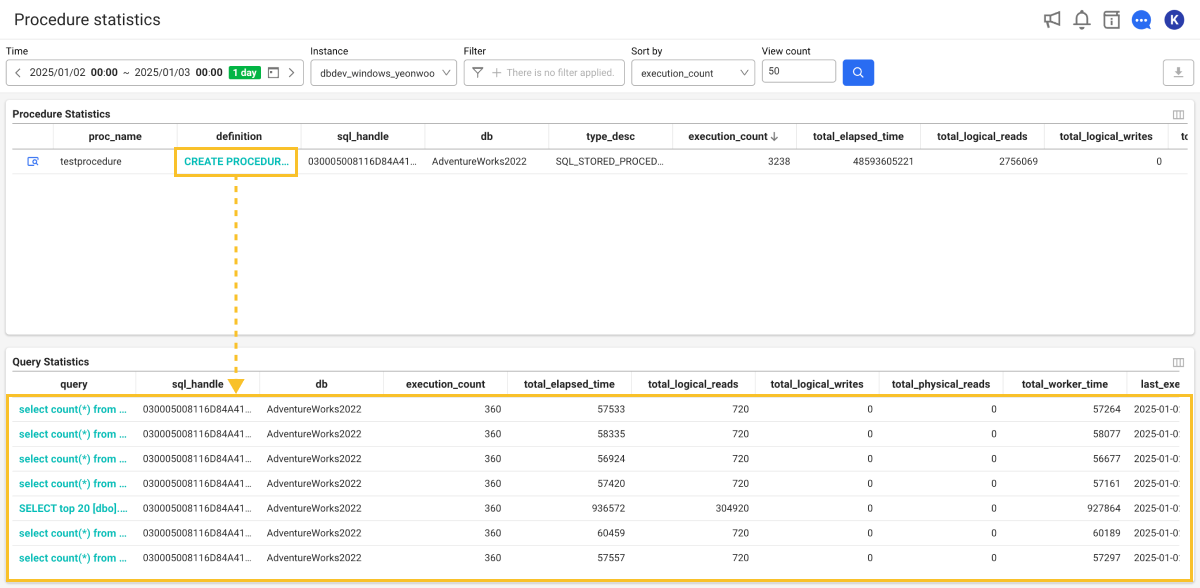
Check the searched results in the Procedure Statistics section and then select the definition column.
-
Individual query execution information for the selected procedures appears in the Query Statistics section.
-
You can set the Sort by or View count option to display the desired results.
-
When you select
in the list of the Procedure Statistic section, the Procedure Detail window appears, where you can see detailed information about the procedure. For more information, see the following.
-
When you hover the mouse over the defintion column, the SQL definition code can be previewed.
-
For more information on how to use the Time option, see the following.
Screen guide by section
-
Procedure Statistics
This area displays key statistical information for each procedure, providing overall performance data for procedures, such as number of executions and total execution time. You can identify procedures that have long execution times or many logical/physical reads.
-
Query Statistics
In the Procedure Statistics section, when you select the definition column of a specific procedure, individual query execution information for the procedure appears. You can analyze query statistics to identify queries that are being executed repeatedly.

If the query column is selected, the SQL details window appears.
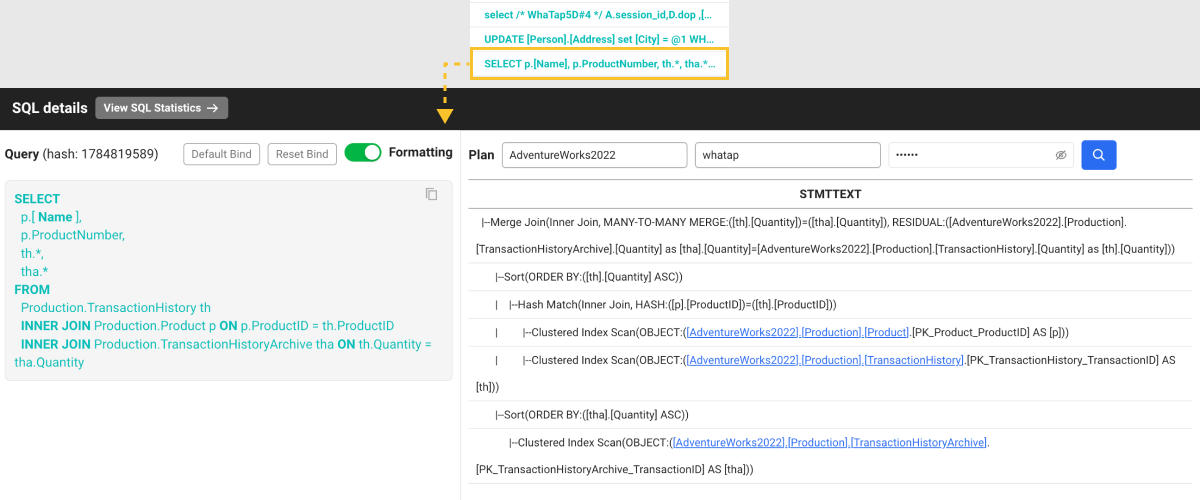
For more information about the SQL details window, see the following.
Checking the procedure information details
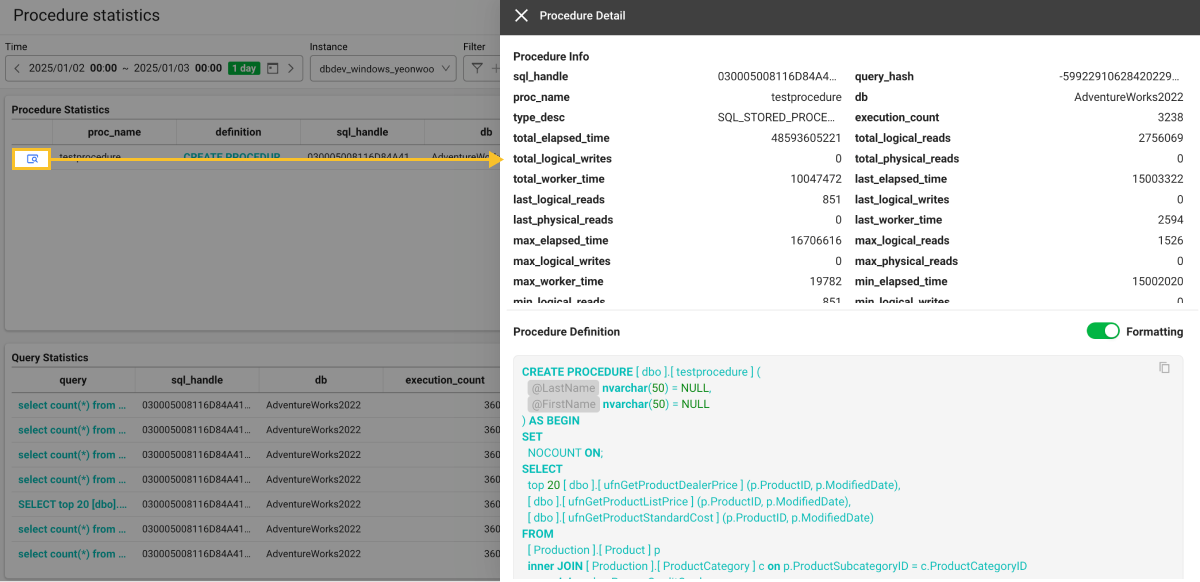
When you select in the list of the Procedure Statistic section, the Procedure Detail window appears, where you can see detailed information about the procedure.
-
Procedure Info
You can see information details on the procedure execution performance data such as physical/logical reads, writes, execution count, and maximum/minimum execution times.
-
Procedure Definition
The SQL definition code of the procedure can be seen.
Filtering the searched results
Adding the filter conditions
-
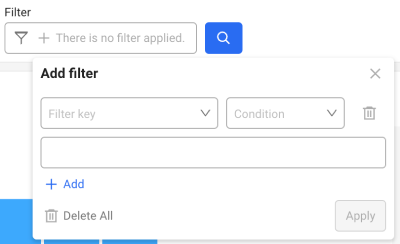
In the Filter option, select
.
-
In Filter key, select a desired filtering criteria.
-
If the value of the selected item is text, you can select any of Includes (blue) and Excludes (red).
-
If the value of the selected item is number, you can select any condition of
==(equal to),>=(greater than or equal to), and<=(less than or equal to).
-
-
In Condition, select a condition.
-
Enter a string or number to match the condition.
-
Select Apply.
-
To add filtering conditions, select Add and then repeat Step 1 to 5. Added conditions are applied based on AND (
&&). -
To delete some items while adding conditions, select
on the right of the filter conditions. To delete all conditions, select
Delete All.
-
To quickly delete the conditions applied to the Filter option, select
.
Modifying the filter conditions
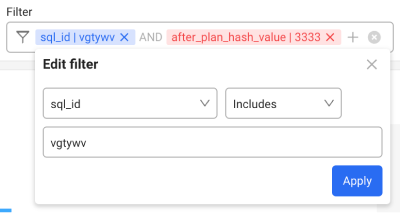
Click any applied to the Filter option. If the Edit filter window appears, modify any desired items and then select Apply.
Downloading the viewed result
You can download the search results for each section in CSV file format. Click on the upper right of the screen and then select Procedure Statistics or Query Statistics.
The name format of the downloaded CSV file is as follows:
-
Procedure Statistics: Procedure_Statistics_
YYYYMMDD_HHMMSS.csv -
Query Statistics: Query_Statistics_
YYYYMMDD_HHMMSS.csv