Database size
Home > Select Project > Stat/Report > DB size
It aggregates the sizes of tables for each database and provides trend data in a chart. You can identify and manage the trend in database capacity growth. You can prepare for rapid capacity increases by identifying them in advance.
Database size can affect the performance. You can prepare to troubleshoot performance issues because the increase in size can delay the query execution. It is also required to identify and prevent problems in advance that may increase the size due to incorrect queries or database structure issues.
The trend in database size helps you understand usage patterns and data growth. You can predict future capacity requirements and take possible actions. Monitoring these changes helps you optimize the resources and costs.
Before use
Assigning the query role
To collect the database sizes, it is required to set the following roles:
grant connect any database to whatap;
grant view any definition to whatap;
For the tables that fall under the following cases, size collection does not happen.
-
Tables that start with
dt -
is_ms_shipped=0(excluding system objects fromsys.objects) -
object_id> 255 -
For the Azure SQL Server, the master database size cannot be collected.
Setting the agent options
You can set the following agent options to collect the database sizes.
-
tables Boolean
Default
trueIt collects the table sizes. In Stat/Report > DB size, you can see the table size by selecting the database.
-
tables_hour Int
Default
5Set the time when data is to be collected to store the table sizes. The default value is
5and collection starts at 5 AM. -
tables_min_row Int
Default
10000When collecting the table information, table data with the number of rows smaller than the set value is not collected.
Basic screen guide
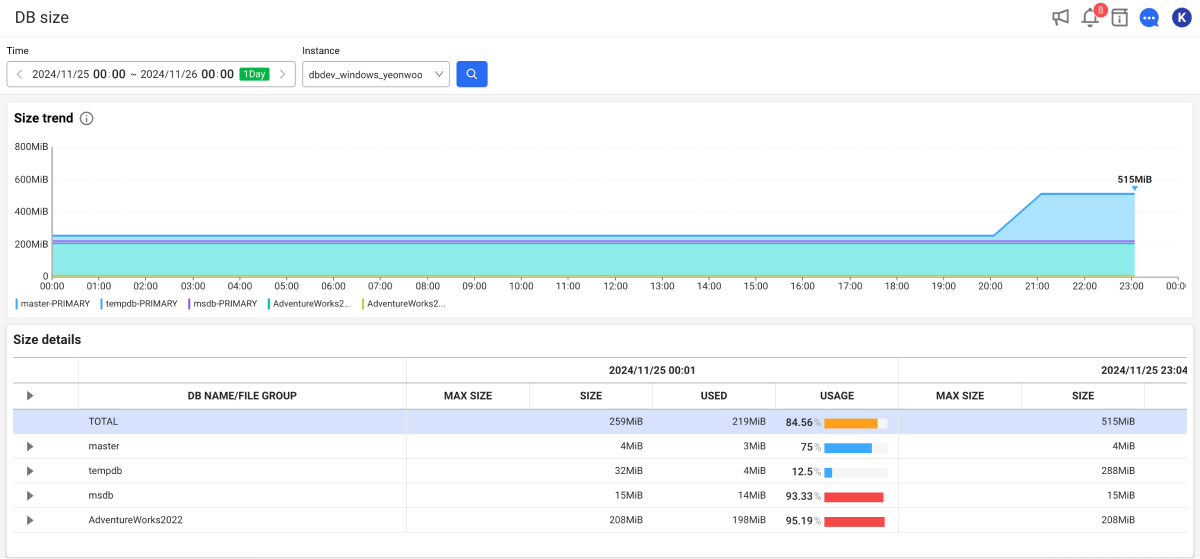
-
Set the time to search in Time. You can also select a lookup time by clicking the green button.
-
Select a target to view in Instance.
-
Select
 .
.
- The query period can be set up to 3 weeks. In case of a view for 3 days or more, the graph displays the daily average.
Size trend
It displays a graph for the changes in storage capacity of the database over the query time. This allows you to see the increase or decrease trend of the database size at a glance.
-
You can predict data growth patterns by checking the storage increase trend of a specific database.
-
By comparing storage capacity changes across multiple databases, you can identify which databases are consuming the most storage.
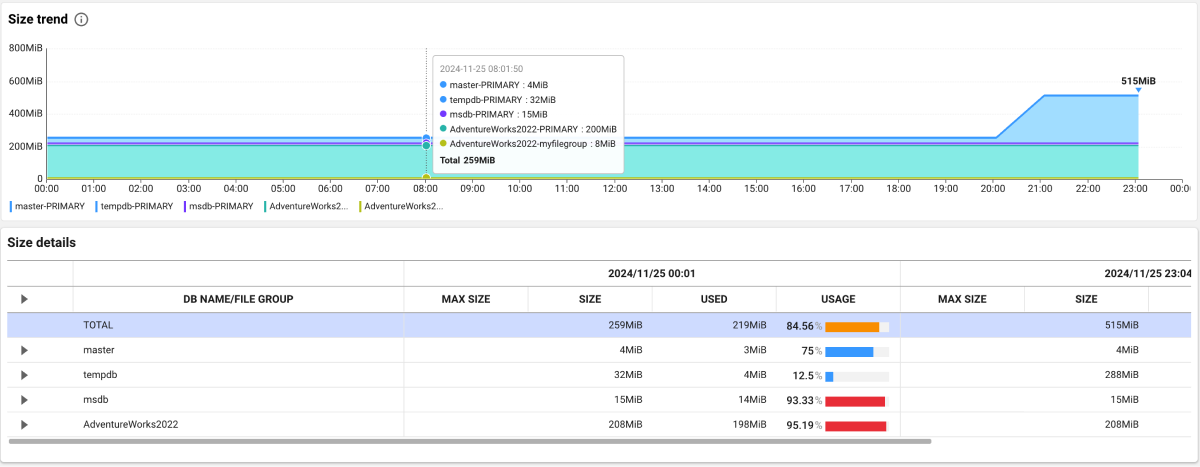
The chart displays the sizes for each database in different color. Hover your mouse over the chart and move it left and right to view the details. You can see information details on the sizes for each database at a specific time point through the tooltip.
-
Time Axis (X-axis): Time at which database storage changes are recorded.
-
Capacity Axis (Y-axis): Total database size (unit: MiB). It visually displays how the database's capacity changes over time.
Size details
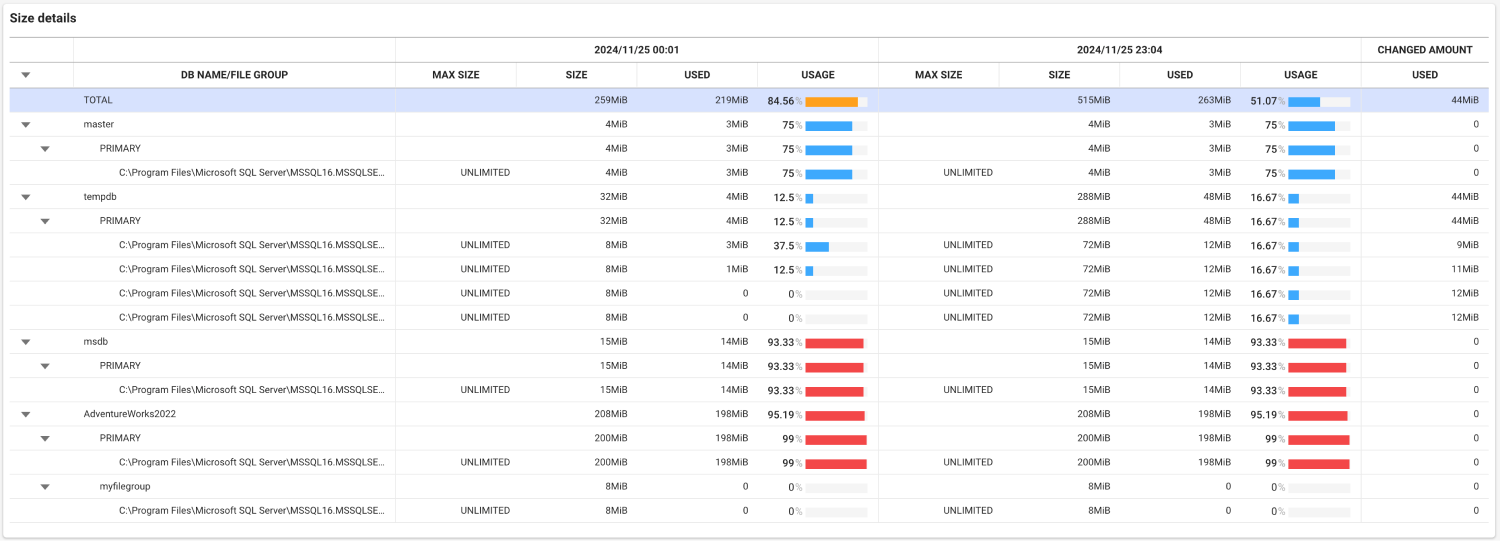
You can check the storage capacity and usage for databases and file groups in detail. Analyze the efficiency of the storage space through the database file size, usage, maximum size, and the like, and take proactive measures when the capacity is running low.
-
You can expand the tree structure to see the usage for each database and file group.
-
You can analyze the data growth by comparing usage changes in the same database over different time zones.
-
You can proactively prevent storage space shortages by checking databases or file groups with high USAGE.
Guide to columns
For more information about each column in the Size details section, see the following.
-
DB NAME/FILE GROUP: Database name and the filegroup name of the database. The structure of each database and file group can be expanded or collapsed in tree format.
-
MAX SIZE: Pre-defined maximum size of database or file group. UNLIMITED indicates that there is no size limit.
-
SIZE: It represents the total size of the current database or file group.
-
USED: It is the actual amount of storage space in use.
-
USAGE: It displays the utilization in percentage (%). It is the ratio of utilized capacity to the total database size. If the utilization is high, consider securing the additional capacity.
-
CHANGED AMOUNT: It displays the change in usage over the query time range.
Table size (TOP 50)
If you select a database in the Size details section, you can check the list of sizes for each table corresponding to the top 50 sizes in the database. It provides information about the top 50 tables that use the most storage space. This allows you to identify and optimize the tables that hold large amounts of data.

-
By quickly identifying which tables are using the most storage space, you can optimize the data structure or manage the storage.
-
By checking the UNUSED SPACE SIZE value, you can identify the tables that are taking up much free space unnecessarily.
-
By comparing the number of rows in each table, you can identify the tables with unusually large amounts of data and perform further analysis and tuning.
Click the  Download button at the top right of the list to export the displayed table list to a CSV file. The column configuration and display format visible on the screen are reflected in the file as they are, and the saved file name is table_size_top50.csv.
To change the order of table columns or hide specific columns in the Table size (TOP 50) section, select  on the upper right. For more information about the column configuration, see the following.
Viewing the object details
TABLENAME When a column is selected, the Object Detail window appears, where you can see detailed information about the objects in the table.
To use the Object Detail feature, grant users appropriate object query roles in SQL Server. You can set roles by executing the following command.
grant view any definition to {DB_User};
Guide to columns
For more information about each column in the Table size (TOP 50) section, see the following.
-
DB: Name of the database to which the table belongs.
-
FILEGROUP: Name of the file group where the table is stored.
-
SCHEMANAME: Name of the schema to which the table belongs.
-
TABLENAME: Name of the table. When a table name is clicked, the Object Detail window appears, where you can see detailed information about the object.
-
TOTAL SPACE SIZE: Total size of storage space (MiB) used by the tables.
-
USED SPACE SIZE: Size of space (in MiB) used in the table.
-
UNUSED SPACE SIZE: Size of free space (in MiB) not used in the table. If this value is large, you may need to optimize the table structure or clean up the data.
-
ROWS: Number of data rows stored in the table.