Lock tree
Home > Select Project > Analysis > Lock Tree
SQL Server is a useful tool to monitor the locking status occurring in the database in real time and check detailed information related to the lock of a session. This feature allows users to quickly identify locking issues that may cause database performance degradation and analyze its cause.
The provided key features are as follows:
-
Lock status visualization: You can check the locks that occurred during the day in a visualized graph. This allows you to see the time zone and frequency of the locks occurred.
-
Provision of session information: It provides detailed information about the sessions that caused the lock in a table format. You can check information such as each session status, waiting time, waiting type, and SQL statement being executed.
- Visual lock trend by time: Through the 1-Min Lock Trends and Lock Wait Sessions features, the lock occurrence data can be analyzed in time zones.
Basic usage guide
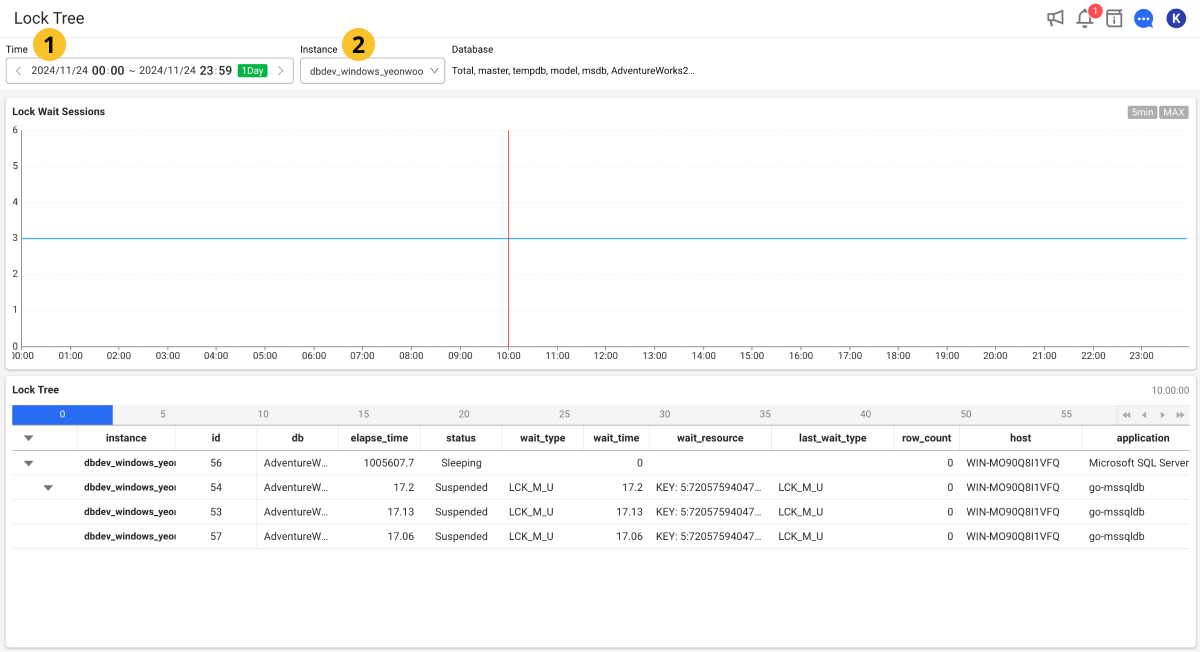
-
Select the date to view and set the time in Time at the top of the screen.
-
Select an instance to monitor.
You can check the lock that occurred during the set time on the selected instance.
If any lock occurs during the set period, you can analyze whether locks are concentrated in a specific time period or whether a specific session continuously causes locks in the Lock Wait Sessions graph and the table at the bottom.
- You can see the data in 5-second increments by dragging within 3 hours on the chart. However, the data in 5-second increments can only be viewed within the most recent month. The data earlier than one month can only be viewed as 5-minute summary data. For example, you can drag (drill down) lock tree data from 40 days ago for the 5-minute summary data, but you cannot see 5-second data.
Lock Wait Sessions
The Lock Wait Sessions feature allows you to analyze the lock wait sessions. Depending on the query period, the lock wait session data is provided at 5-minute intervals when the query is for 3 hours or more, and at 5-second intervals when the query is for less than 3 hours. You can also adjust the time range by dragging the chart flexibly.
1-Min Lock Trends
If you click a specific time zone in Lock Wait Sessions, the lock occurrence status for 30 minutes, from 15 minutes before to 15 minutes after is visualized. This allows you to effectively analyze the lock occurrence trend at 30-minute intervals.
Total Locks indicates the total number of locks generated in the time zone.
Viewing time
1-Min Lock Trends and Lock Tree tables are timed based on the maximum number of locks that occurred at the clicked time in Lock Wait Sessions. This allows you to find the zone with the most locks.

If you click the bar of a different time zone in the 1-Min Lock Trends chart with the Lock Wait Sessions unchanged, the time range is synced to the Lock Tree table by using the seconds with the highest number of locks for the minute. This allows you to see the information reflected in the Lock Tree table when changing the time zone.

-
Viewing for 3 hours or more (using 5-minute data)
The bar color of the 5-minute zone from the time of inquiry appears more prominent.
When the
07:15:00time point is clicked, the color of the07:15:00-07:20:00zone's bar chart appears more prominent.
-
Viewing for less than 3 hours (using 5-minute data)
It is useful for analyzing the locks that occur within short time intervals.

Column information guide
Details for each session are provided in the following columns:
| Item | Description |
|---|---|
application | Name of the application that created the session. |
client | Name or IP address of the client that created the session. |
db | Name of the database to which the session is connected. |
elapsed_time | Elapsed time (milliseconds) since the session started. It is used to measure how much time has passed since a lock occurred. |
host | Name of the client host that created the session. |
id | Unique ID for the locked session. |
instance | Agent or instance name. |
last_wait_type | Last type that the session waited for. |
row_count | Number of rows processed in the session. |
query | Entire text of the SQL statement running in the session. |
query_param | Parameter value of the SQL statement running in the session. |
status | Current status of the session. For example, there are running, suspended, sleeping, and such which indicate whether the session is active or waiting. |
user | Name of the user connected to SQL Server. |
wait_resource | It indicates the resource the session is waiting for. |
wait_time | Time (milliseconds) that the session has been waiting. |
wait_type | Type of wait the session is in. For example, it includes information such as lock wait or IO wait. |
WhaTap basically stores the client-related information.
wait_type
The wait_type column is a value that indicates a specific resource or event on which a query or transaction is waiting in SQL Server. SQL Server uses various wait types internally to manage the system performance and diagnose problems.
I/O-related waits
-
PAGEIOLATCH_EX: It waits for an exclusive lock to read a data page. -
PAGEIOLATCH_SH: It waits for a shared lock to read a data page. -
FILEIO: It waits for a file I/O operation.
Lock-related waits
-
LCK_M_X: Exclusive lock wait. -
LCK_M_S: Shared lock wait. -
LCK_M_U: Update lock wait. -
RESOURCE_SEMAPHORE': Resource semaphore wait when waiting to acquire memory resources.
Other waits
-
CKPACKET: Inter-thread synchronization wait in parallel queries. -
ASYNC_NETWORK_IO: It is waiting for the network I/O operations. -
SLEEP_*: It is waiting due to aWAITFORorWAITFOR DELAYstatement. -
BROKER_*: It waits for a service broker message. -
LOCK_MANAGER: Lock management waits and the waits related to the lock manager in SQL Server.
wait_resource
The wait_resource column provides information about the resource on which a request running in SQL Server is waiting. A string for a request waiting for a specific resource indicates the specific ID or location of the resource being waited for.
For key resource types and examples, see the following:
-
PAGE: <file_id>:<page_id>It indicates a wait for a data page.
e.g.
PAGE: 1:12345 -
FILE: <file_id>It indicates a wait for the entire data file.
e.g.
FILE: 1 -
0BJECT: <cobject_id>It indicates a wait for a specific table.
e.g.
0BJECT: 123456 -
DATABASE: <database_id>It indicates a wait for a specific database.
e.g.
DATABASE: 5 -
KEY: <key_id>It indicates a wait for an index key or a key of another data structure.
e.g.
KEY: 67890 -
RID: <file_id>:<page_id>:<row_id>If the
wait_resourcecolumn isRID(Row Identifier), it indicates a wait for a specific row in SQL Server.RIDis a unique ID that identifies a specific row in a table in SQL Server.e.g.
RID: 1:1234:5678
-
<file_id>represents the ID of the data file. -
<page_id>represents the page ID. -
<object_id>represents the ID of the table. -
<database_1d>represents the ID of the database. -
<key_id>is the key ID. -
<row_id>represents an ID that identifies a row within the page.
Analyzing with AI
Click the WhaTap AI button on the screen to open the WhaTap AI chat window, where the queried screen data is summarized and the analysis result is shown as a conversation. After reading the result, you can continue with follow-up questions in the same conversation.
-
The data used for the analysis is three sets: the trend for the whole query range, the 30-minute interval aggregation, and the lock tree snapshot at the selected point in time.
-
The analysis target is the data queried on the screen. If you change the query conditions and analyze again, the analysis is based on the changed data.
-
The conversation history is recorded in the
AI Analysis - {screen name}format.