Dead lock
Home > Select Project > Analysis > Dead Lock
It provides detailed information based on the data collected at an interval of 5 seconds for deadlocks that occurred in SQL Server.
-
Deadlock is a situation where two or more sessions are waiting for resources owned by each other and never end. SQL Server detects this deadlock condition and resolves it by forcibly terminating specific transactions. However, frequent deadlocks cause system performance degradation and poor user experience, so proper monitoring and tuning are required.
-
This feature is available in DBX agent 2.2.2 or later.
-
This feature requires the following permission. Use the SQL command below to grant it.
USE master;
GRANT EXECUTE ON xp_readerrorlog TO whatap;
Basic usage guide
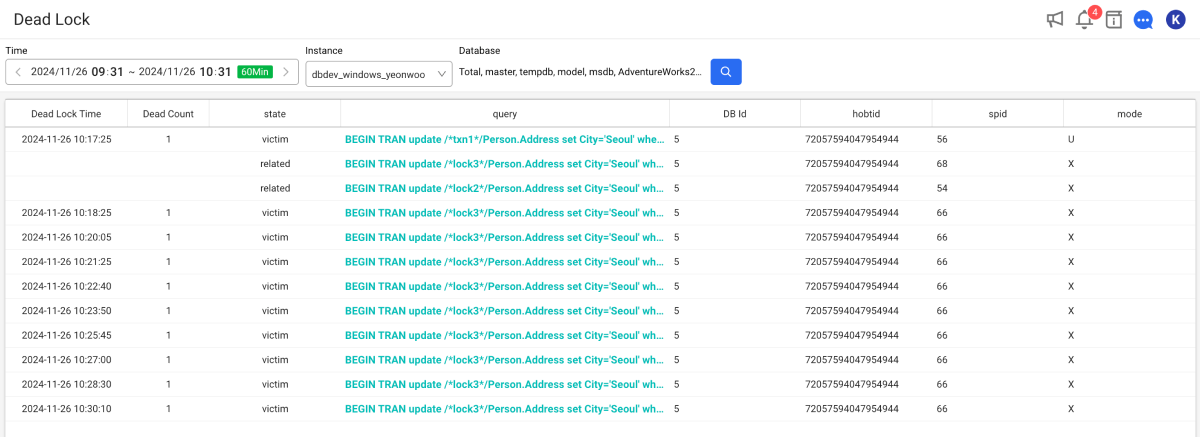
Users can query deadlock events by selecting a specific time, instance, and database.
-
Select the date to view and set the time in Time at the top of the screen.
-
In Instance, select agents (instances) and databases to monitor.
-
Select
 .
.
You can see the deadlocks that occurred during the set period in the selected instance. Hover the mouse over the query column to preview the SQL statement.
- The query time can be set up to 3 weeks.
Analyze the causes of deadlock occurrence and identify frequent deadlock patterns.
-
Redesign queries to minimize duplicate access to the same resources.
-
Use appropriate indexes to streamline data access paths.
-
Keep transactions short and avoid unnecessary tasks within them.
-
If necessary, adjust lock priorities or restructure queries to reduce the potential of conflicts.
Column guide
| Item | Description |
|---|---|
| Dead Lock Time | Deadlock occurrence time. This allows you to analyze transactions over a specific period. |
| Dead Count | Number of deadlocks that occurred in the same period. You can assess the problem severity by determining the frequency of deadlocks. |
| State | Deadlock event staus. You can check whether the detected deadlock was handled. |
| Query | Content of the query that caused the deadlock. It provides important information for query optimization and deadlock resolution. |
| DB Id | ID of the database where the deadlock occurred. By identifying the database, the cause of the problem can be narrowed down. |
| HoBT Id | ID of the resource (Heap or B-Tree) where the deadlock occurred. |
| SPID | Process ID (Session Process ID) involved in the deadlock. You can identify the session that caused the problem. |
| Mode | It Indicates the lock mode (e.g. shared lock, exclusive lock) where the deadlock occurred. |
Analyzing with AI
Click the WhaTap AI button on the screen to open the WhaTap AI chat window, where the queried screen data is summarized and the analysis result is shown as a conversation. After reading the result, you can continue with follow-up questions in the same conversation.
-
The data used for the analysis is the 15 most recent entries in the queried deadlock history.
-
The analysis target is the data queried on the screen. If you change the query conditions and analyze again, the analysis is based on the changed data.
-
The conversation history is recorded in the
AI Analysis - {screen name}format.