Monitoring Multiple Instances
Home > Select Project > Dashboard > Monitoring Multiple Instances
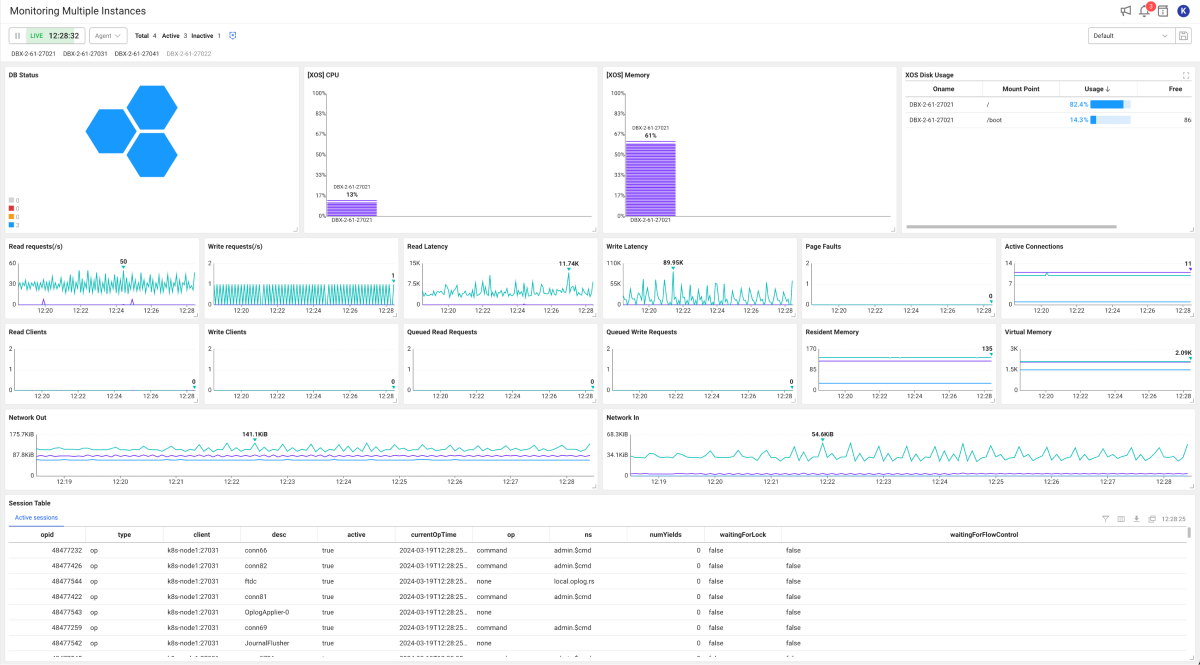
While you can monitor only one agent (instance) in Monitoring a Database Instance, Monitoring Multiple Instances allows you to monitor and manage multiple agents (instances).
You can compare and analyze key performance metrics occurring in each instance at a glance. You can effectively perform monitoring by aggregating data such as the number of agents running, the sum of all active sessions, and the number of transactions. Users can easily check the changes in metric values over time and high performance metrics for each instance through graph charts.
Additionally, users can see the longest-lasting active sessions, which can be used as a basis for diagnosing and resolving the system performance bottlenecks.
If you select an agent to compare in Dashboard > Instance List, and then select Multi view, the Monitoring Multiple Instances menu appears.
Viewing the past data
The dashboard basically provides the real-time monitoring feature but the past data can be viewed using the time selector at the top of the screen. In the time selector, select ![]() and then set the following time. It updates the data in widgets placed on the dashboard based on the set time.
and then set the following time. It updates the data in widgets placed on the dashboard based on the set time.
For more information on how to use the time selector, see the following.
Checking the agent
Checking the agent connection status
On the upper left of the screen, the right area of the time selector provides information that allows you to check the status of agents connected to the project. This allows you to immediately check whether the target application server is running.
-
Total: Number of all agents connected to the project
-
Active: Number of active agents
-
Inactive: Number of inactive agents
-
 : Can display or hide inactive agents.
Agent-based monitoring
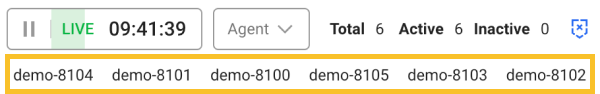
By default, the dashboard displays the metrics collected from all agents in charts and you can also view the data by agent. Select one or more agents under the time selector. The data of the widgets on the dashboard is updated with the metrics of the selected agent(s).
To select all agents again while one or more agents is selected, deselect them or select Total.
If there are numerous agents connected to the project, it is efficient to set the agent names to be short. For more information about the agent name setting, see the following.
Monitoring each classified agents
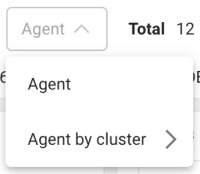
You can select and monitor agents by each group classified through agent settings.
-
Agent: You can select an individual agent or all agents.
-
Agent by cluster: In case of the database that consists of multiple clusters, agents can be monitored by cluster.
To use Agent by cluster, configure the following options for the DBX agent (whatap.conf). For more information, see the following.
cluster_name={cluster_name}
Editing a dashboard widget
The widgets on the dashboard can be adjusted to the desired size and placed in the desired positions. You can also delete unnecessary widgets or add them again.
Resizing a widget
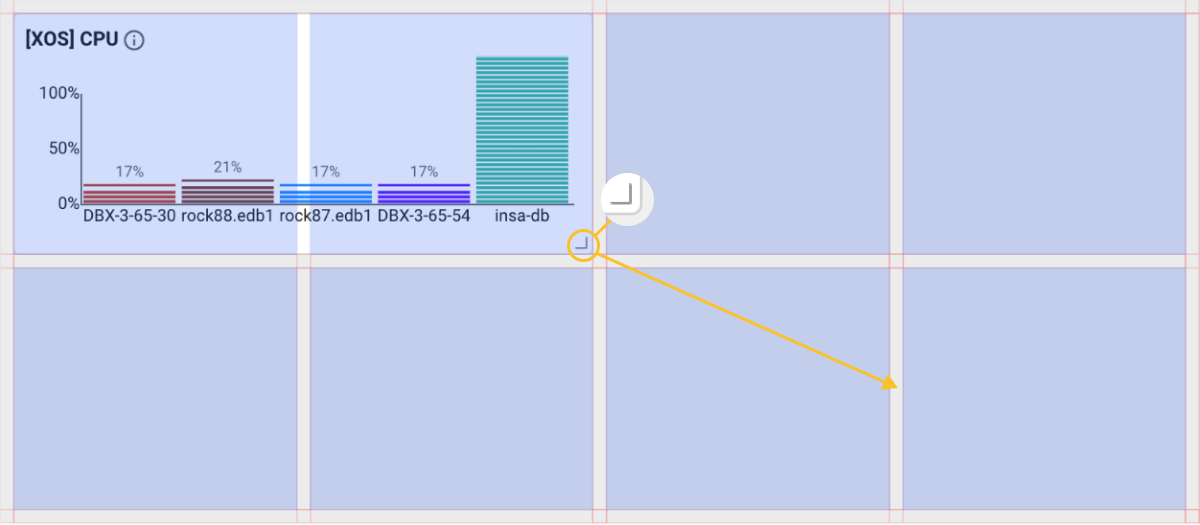
Click and hold the mouse on the  element at the lower right of the widget, and then drag it to the desired size. Grids with a uniform horizontal-to-vertical ratio appear and the size of the widget can be adjusted in each grid.
Moving a widget
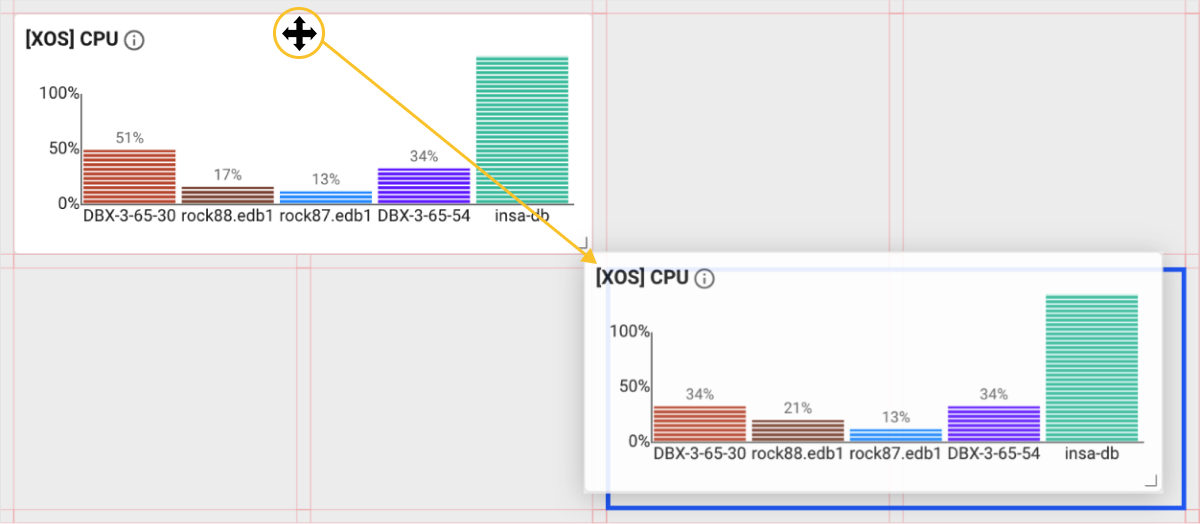
When you move the mouse cursor to the top of the widget, the cursor shape changes to  . At this time, you can move the widget by dragging with your left mouse button and move to the desired position.
Deleting a widget
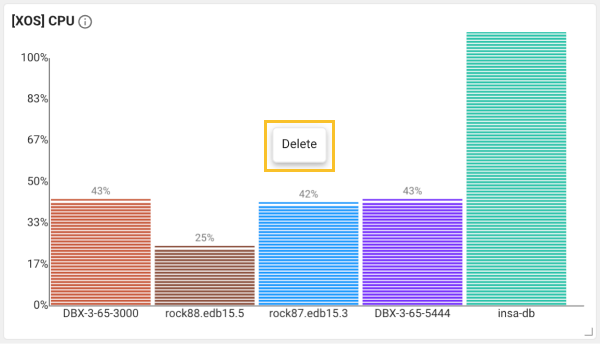
Right-click on a widget to delete. If you select Delete, the widget is deleted from the dashboard.
Adding a widget
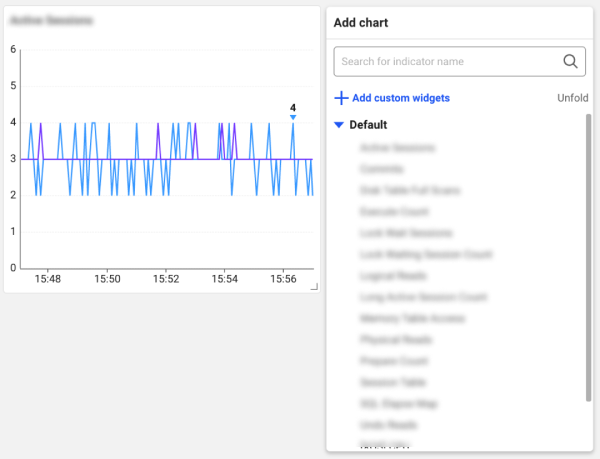
Move the mouse cursor to an empty space on the dashboard and then right-click on it. Select a widget to add from the pop-up menu. Place the widget to the desired position and then resize it.
-
For more information about the widgets that can be placed on the dashboard, see the following.
-
In addition to the metrics provided by default on the dashboard, you can add the desired metrics. For more information about custom widgets, see the following.
Custom widget
The custom widget feature allows users to add their own metrics in addition to the metrics provided by default on the dashboard. If you have metrics to continuously monitor on the dashboard in addition to the metrics provided by default, use the custom widget feature.
Add
-
Right-click an empty space on the dashboard.
-
On the pop-up menu, select Add Custom Widgets.
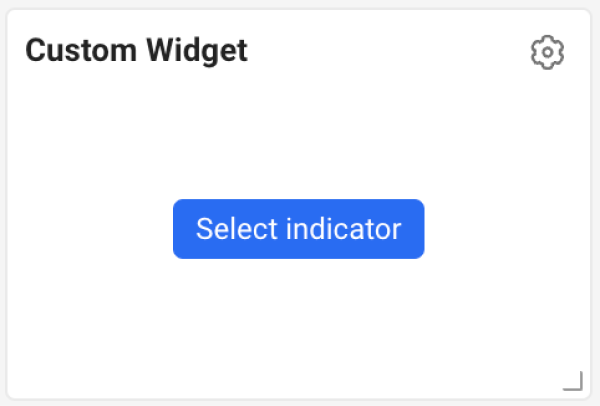
-
If Custom Widget is created on the dashboard, select Select indicator.
-
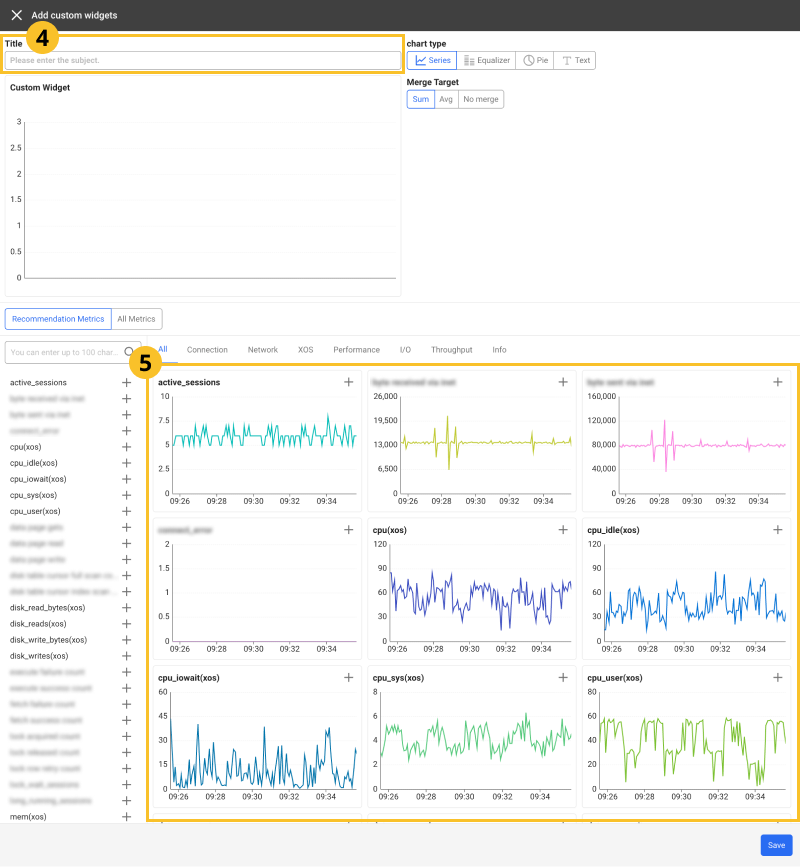
When the Add Custom Widgets window appears on the right of the screen, enter the widget name in Title.
-
In the metrics list at the bottom of the screen, select the
 button on the upper right of the metric to add.
 -
After the metric has been changed, select Save.
-
You can add up to four metrics. To add metrics, select
. -
Ti change the metric, select a different metric in the metrics list. If you select
, the metric is added. -
If you do not enter the widget title, it is saved as a custom widget.
Selecting the chart type
In chart type of the Add Custom Widgets window, you can select the following types.
-
 Series: Time series chart that displays the metric changes over time.
 -
 Equalizer: Bar graph chart that can compare the performance for multiple metrics. By visually displaying various metrics on one screen, you can easily see the overall performance status.
 -
 Pie: Pie chart useful for checking the composition ratio for multiple metrics relative to the whole.
 -
 Text: It displays the figures for the metrics in text.
Selecting the data merging method
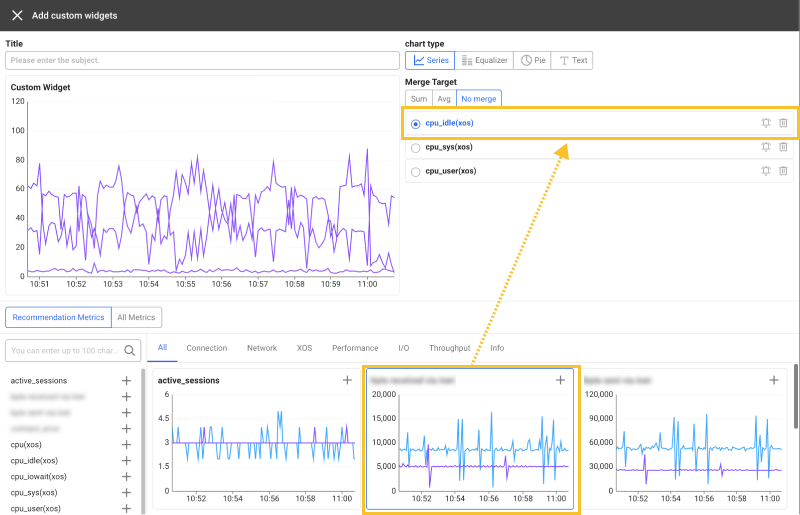
In Merge target of the Add Custom Widgets window, you can select the way to display metrics collected from agents.
-
Sum: It sums up the metric values collected from multiple agents and displays them as a single value. This option is useful for displaying the overall total by merging data from multiple agents.
-
Avg: It averages the metric values collected from multiple agents and displays them as a single value. This option is useful for checking the average performance or status of all agents.
-
Max: By selecting the largest value among the metric values collected from multiple agents, it displays a single value. This option is useful for identifying the highest performance consumption or worst performance cases among agents.
-
No Merge: It displays the metrics for each agent.
The available merge method may differ depending on the chart type.
Changing a metric
You can change or add metrics for the metrics added to the custom widget.
-
Select
 on the upper right of the custom widget added on the dashboard.
 -
When the Add Custom Widgets window appears on the right of the screen, select a metric to change.
-
Select a metric to change from the metric list at the bottom of the screen. To add a metric, select
on the upper right of the metric to add. -
After the metric has been changed, select Save.
The features of the icon buttons in the list for added or changed metrics are as follows:
-
 : You can exclude the metric from the custom widget.
 -
 : You can set the alert for the metric. When the button is selected, the Alert > Event Configuration appears. For more information about the Metrics event setting, see the following.
Using the widget options
The icons displayed on the widget function as follows:
-
 : You can see the features and information for major widgets. (multilingual support planned)
 -
 or
or  : You can enlarge or reduce the range of the vertical axis.
 -
 : You can view the widget's data on a wider screen.
 -
 : A detail window appears where you can search the data of the widgets separately by agent.
The provided options may differ depending on the widget.
Setting presets
You can save and load the settings and layouts for widgets on the dashboard. You can create a new preset by adjusting its size and placing it on the desired position.
-
Using Default, the specified preset cannot be changed.
-
You can save or modify the presets with the Edit project role. For more information about the member roles, see the following.
Creating a new preset
-
Place the widgets in the desired format on the dashboard. You can also resize and place only the widgets to be frequently checked.
-
On the upper right of the screen, select
 .
. -
Enter a new preset name.
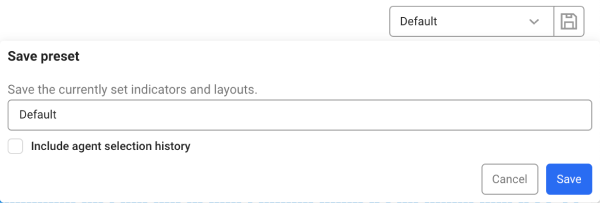
To save the selected agent data, select Include agent selection history.
-
Select Save.
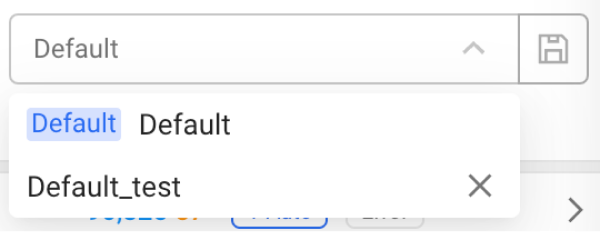
You can see the newly saved preset from the preset list.
-
If any changes are made to the newly created preset, save the preset again. Select
and then save the preset with the same name. Any changes are overwritten in the existing preset. -
If you go to another menu without saving changes on the dashboard, the changes are not saved.
-
Presets are saved on a project basis and can be shared with other users.
Deleting presets
If you have unused presets, you can delete them from the preset list. Select ![]() on the right of the item to delete from the preset list.
on the right of the item to delete from the preset list.
The Default preset cannot be deleted.
Learning about the main widgets
The types of widgets that can be placed on the dashboard are as follows.
XOS widgets
-
[XOS] CPU
You can see the CPU usages for each agent in real time.
-
[XOS] Memory
You can see the memory usages for each agent in real time.
-
[XOS] Disk Usage
Displays the disk utilizations, free sizes, and total sizes for each agent.
-
: The Disk usage details pop-up window appears. You can check the chart that displays the disk usage by time zone. You can check the data by instance. By selecting Size, Free, or Used, you can see the total size, remaining size, and size in use.
-
: You can expand the table on the widget to a wider screen.
TipIf there is no data displayed, add the following settings to the xos.conf file.
xos.conf# Off if the disk usage is 0; unit: second
disk_usage_interval=60 -
Database widgets
The provided widgets allow you to check the status of various system resources, such as CPU, memory, and disk I/O, as key metrics for database performance analysis.
-
DB Status
You can see the status of agents (instances) in the project. Individual agents are displayed in a hexagon. If you hover your mouse over it, the current status and IP address appear.
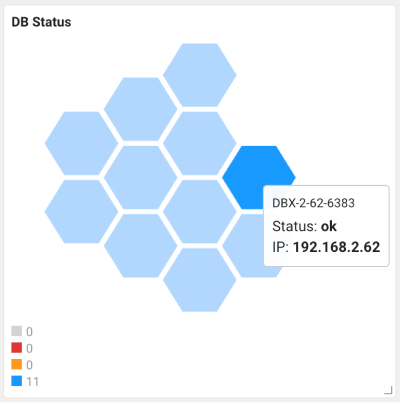
The status of the agent can be classified as follows:
-
Normal: Number of normal agents.
-
Inactive Agents: Number of disconnected agents.
-
-
Read requests
A widget that measures the number of read requests per second. Read requests are tasks involving queries, aggregation, index scans, and the like that query or retrieve data from the database. It is useful to detect any changes in database usage patterns.
Calculation:
query$opcounters+getmore$opcounters -
Write requests
A widget that measures the number of write requests per second. Write requests are tasks involving addition, update, and deletion in the database. It is useful to detect any changes in database usage patterns.
Calculation:
insert$opcounters+update$opcounters+delete$opcounters -
Read Latency (
latency$reads$opLatencies)A widget that measures the latency (in microseconds) of read tasks that is the time taken for a client to request a read task and perform the task in the database. If a read task has a high latency consider the way to improve the performance by optimizing indexes or improving queries.
-
Write Latency (
latency$writes$opLatencies)A widget that measures the latency (in microseconds) of write tasks that is the time taken for a client to request a write task and perform the task in the database. If a write task has a high latency consider the way to improve the performance by optimizing indexes or performing a batch job for writing.
-
Page Faults (
page_faults$extra_info)This widget measures the number of page faults that occur. A page fault occurs while in memory management and occurs when a memory page requested by a process does not exist in physical memory and the page must be read from the disk. At this time, disk I/O may occur and the task may be delayed. This usually means that the system is running out of memory.
You can check whether the read and write tasks in the database depend on the disk I/O and whether low memory caused performance issues.
NoteFor more information about the page faults, see the following link.
-
Active Connections (
active$connections)A widget that measures the number of connections by active clients. You can monitor the number of connections from the clients that the database server can handle at the same time. A high number of connections means you need to increase server capacity. In the opposite case, a problem may have occurred. Accordingly, it is better to quickly check the system status.
-
Read Clients (
readers$activeClients$globalLock)A widget that measures the number of clients performing read tasks in the MongoDB's global lock state. You can see how many clients the database server handles for read tasks. This is a useful metric for monitoring the database performance and tracing response times. Excessive read tasks may cause performance degradation.
-
Write Clients (
writers$activeClients$globalLock)This widget measures the number of clients performing write tasks in the MongoDB's global lock state. You can see how many clients the database server handle for write tasks. This is a useful metric for monitoring the database performance and tracing response times. Excessive write tasks may cause performance degradation.
-
Queued Read Requests (
readers$currentQueue$globalLock)This widget measures the number of clients waiting for a global lock to process pending read tasks in the current system. It provides the data to evaluate the performance and scalability of the database. As pending read requests are increasing, the response time for requests from clients may increase and the throughput may reach the limit.
If pending read tasks increase rapidly, you can consider increasing the server resources, analyze the cause of the issue, and resolve bottlenecks through measures such as query optimization and index tuning.
-
Queued Write Requests (
writers$currentQueue$globalLock)This widget measures the number of clients waiting for a global lock to process pending write tasks in the current system. It is required to evaluate the DB performance and optimize the database. As pending write requests are increasing, the system performance may decrease or the response time for requests may increase.
You may need to consider adding resources or identifying which tasks are causing bottlenecks.
-
Resident Memory (
resident$mem)It is the memory size (MB) used by processes on the current system. You can see how much memory they use. Tracing memory usage optimizes the memory usage to increase the performance and becomes an important metric for efficient use of memory resources. It also helps you determine whether more memory is needed or shards need to be added.
-
Virtual Memory (
virtual$mem)It is the virtual memory size (MB) used by processes on the current system. You can see how much memory resources is required on the current environment. If you know the size of the virtual memory, it helps you determine how much memory is required and what measures need to be taken to reduce the virtual memory usage.
-
Network Out (
bytesOut$network)Total bytes sent by the server via connection to a client or other instances. This indicates the total amount of data transmitted when the database server receives any outbound requests and returns responses. You can identify network traffic occurring on the database server, which allows you to optimize the network bandwidth or server resource usage. High network traffic is also associated with performance issues such as increase in response time.
-
Network In (
bytesIn$network)Total number of bytes received by the server via connections from clients or other instances. It indicates the total amount of requests and data received by the database server from outside, and includes the amount of data transmitted when clients send requests and receive responses from the database server. You can see how specific applications or tasks use communication with the database. Additionally, you can plan the system capacity and evaluate scalability by understanding the trend in network traffic.
A global lock is a mechanism used by MongoDB to maintain data consistency. It is applied to both read and write tasks, and acquiring a global lock is required for clients to perform the tasks.
Session Table widget
You can view real-time active sessions in the Session Table widget at the bottom of the screen.
In the table list, the text colors are changed black → orange → Red, which means that the performance of the session is getting slower.
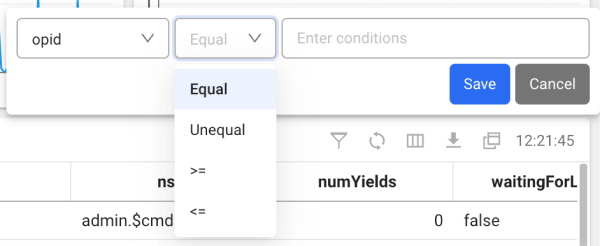
Filtering the table data
-
Select
 on the upper right of the table.
 -
Select a column header and a condition in the table.
-
Enter a desired value in the Enter conditions field.
-
Select Save.
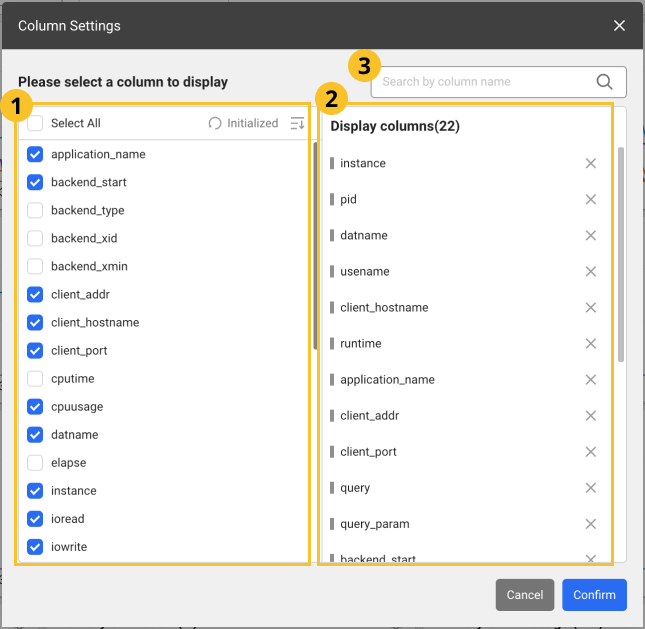
Setting the table columns
You can hide the table header columns or add any of them. You can also change the column order. Select ![]() .
.
-
After configuration, select Confirm to apply the settings in the table.
-
In the
 search bar, enter text to search the desired columns. Only the columns that meet the entered text are displayed.
 -
Images may differ depending on the product, project, or menu.
Adding columns
From the ![]() list, select the items to add as table header columns. To select all items, select Select All.
list, select the items to add as table header columns. To select all items, select Select All.
Deleting columns
From the ![]() list, unselect the columns to delete. Alternatively, select
list, unselect the columns to delete. Alternatively, select ![]() on the right of the item to delete from the
on the right of the item to delete from the ![]() list.
list.
Changing the column order
Drag an item to reposition from the ![]() list, and then move it to the desired position.
list, and then move it to the desired position.
Initializing the configuration
To cancel all changes and reset them, select ![]() Initialized.
Initialized.
Column information guide
- Active session
- Lock tree
- Process information
The following lists the columns in the table displayed for the Active sessions section. The data is collected using the currentOp.
| Item | Description |
|---|---|
opid | Unique identifier of the operation |
type | If the value is op, the operation type can be viewed in the op field. |
host | Server name |
desc | Description of the client including connectionId |
active | If the operation starts, the value is true and if it is idle, the value is false. |
currentOpTime | Start time of the operation |
op | operation type (none, update, insert, query, command, getmore, remove, etc.) |
ns | The name of the namespace appears with Database or Collection. |
numYields | Number of executed operations |
waitingForLock | If the operation is waiting for lock, the value is true and if it has acquired lock, the value is false. |
waitingForFlowControl | If the operation is waiting for flowcontrol, the value is true. |
| Item | Description |
|---|---|
holder type | Type of the holder session (transaction ID, tuple, etc.) |
lock mode | holder_mode (exclusive lock, shared lock, etc.) |
waiter type | Type of the waiter session (transaction ID, tuple, etc.) |
lock request | waiter_mode (exclusive lock, shared lock, etc.) |
The following items are the metrics collected if the XOS agent has been installed.
| Item | Description |
|---|---|
cputime | CPU usage time |
cpuusage | CPU Utilization |
elapse | Elapsed time of CPU usage |
vsize | Virtual memory size (Kb) |
rss | Resident Set Size (RSS) that is the number of physical pages associated with the process. |
state | Process status |
ioread | Actual time spent reading the block (milliseconds) |
iowrite | Actual time spent writing the block (milliseconds) |
pss | Process specific memory usage + Percentage of shared memory occupied by one process |
uid | user id |
cmd | Executing command |
longcmd | Full path of cmd |
Downloading the view list
You can download the current Session Table list in CSV format. Select ![]() on the upper right of the Session Table section.
on the upper right of the Session Table section.
The naming format of the downloaded file is as follows:
-
Active sessions: activeSession_HH_MM_SS.csv
-
Lock tree: lockTree_HH_MM_SS.csv
Active sessions: activeSession_HH_MM_SS.csv
Viewing in a new window
You can see the Session Table list on a new wider screen. Select ![]() on the upper right of the Session Table section.
on the upper right of the Session Table section.