Monitoring a Database Instance
Home > Select Project > Dashboard > Monitoring a Database Instance
In Monitoring a Database Instance, you can monitor the key metrics of the database server, information details on active sessions, lock tree, PQ tree, and process information in real time. You can also see the alerts that could be problematic warnings. By default, the collected data for the last 10 minutes is retrieved in real time. Collected data is updated every 5 seconds.
Basic screen guide
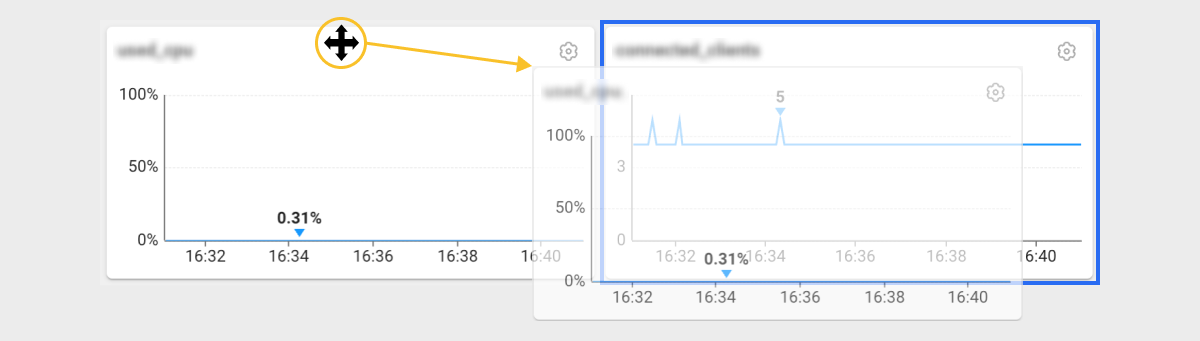
By default, the collected data for the last 10 minutes is retrieved in real time. If you select values in Time and Instance, the collected data is automatically applied to the To view the past data, click the green button in Time and then select the desired lookup time. You can search data up to the last 3 weeks. To query a random date and time, select the To search data from other agents, click Instance and then select a desired agent name. To change the position with another widget, select and drag the upper part of the widget. However, the size of the widget cannot be changed. When a specific time is selected in the widget, the real-time inquiry mode is stopped and the active sessions performed at the selected time zone appear in the The selected time can be seen on the upper right of the Active sessions table. In the Active sessions table list, the text colors are changed black → orange → Red, which means that the performance of the session is getting slower. You can search active sessions, lock trees, and processes information in real time. If you select a specific time of the chart in the widget, the real-time inquiry mode is stopped and the session performed at the selected time appears in the table. A time selection button appears above the table to search data in 5-second increments.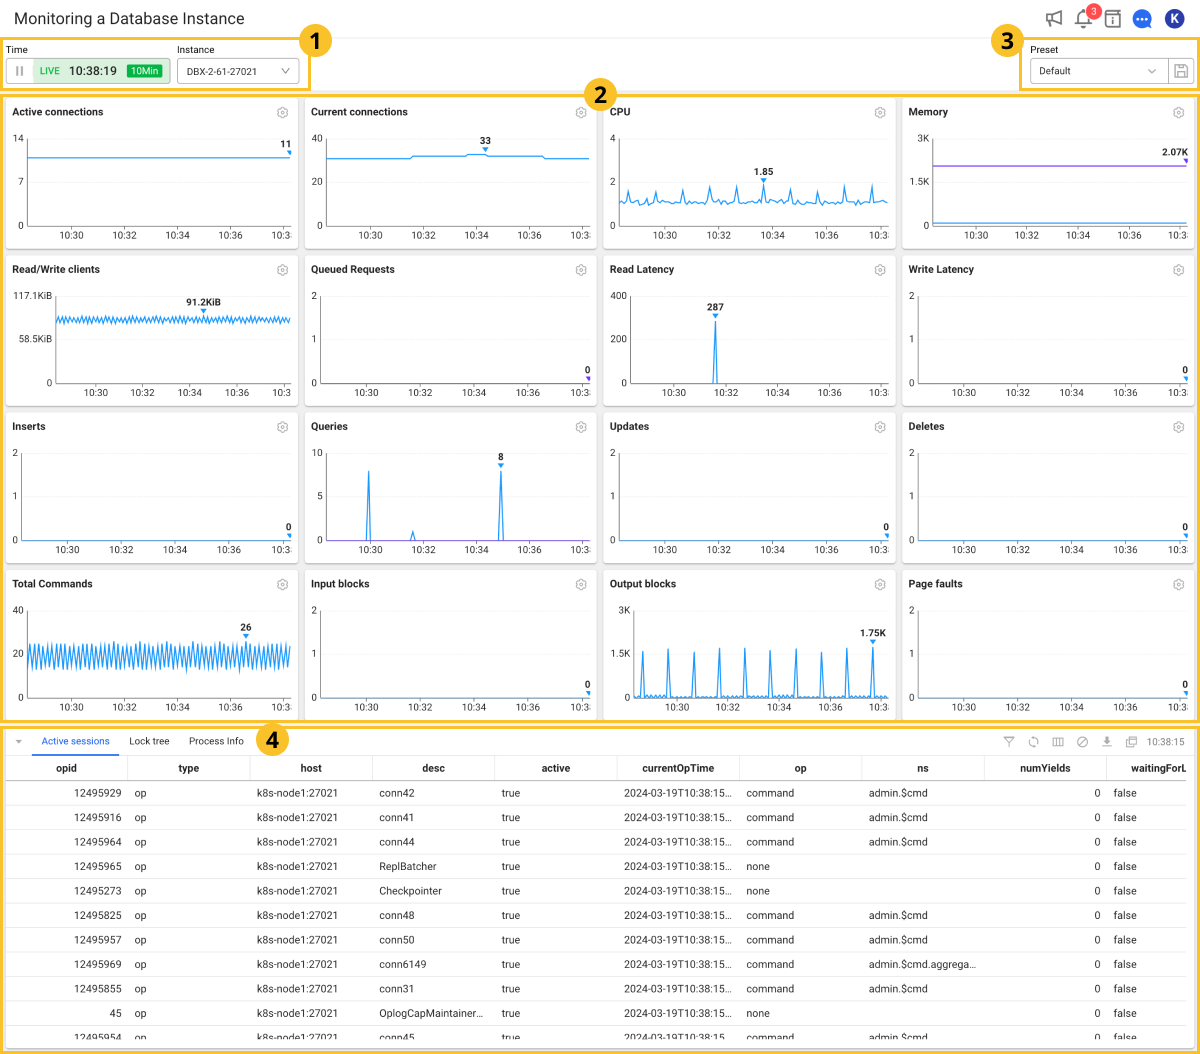
![]() Selecting the lookup time and target
Selecting the lookup time and target![]() graph chart and
graph chart and ![]() Active sessions table.
Active sessions table.
![]() button in Time. If you click the text range for date and time, the option appears to select the date and time. To search data in real time again, select
button in Time. If you click the text range for date and time, the option appears to select the date and time. To search data in real time again, select ![]() .
.![]() Graph chart section
Graph chart section![]() Default displays 16 metrics saved as presets as a graph chart widget. The horizontal axis of each widget is time, and the vertical axis is the metric number. To know the meaning of each metric, select
Default displays 16 metrics saved as presets as a graph chart widget. The horizontal axis of each widget is time, and the vertical axis is the metric number. To know the meaning of each metric, select ![]() next to the name or see the following.
next to the name or see the following.
![]() Active sessions table. After that, a button that allows you to view the data every 5 seconds appears on the Active sessions table.
Active sessions table. After that, a button that allows you to view the data every 5 seconds appears on the Active sessions table.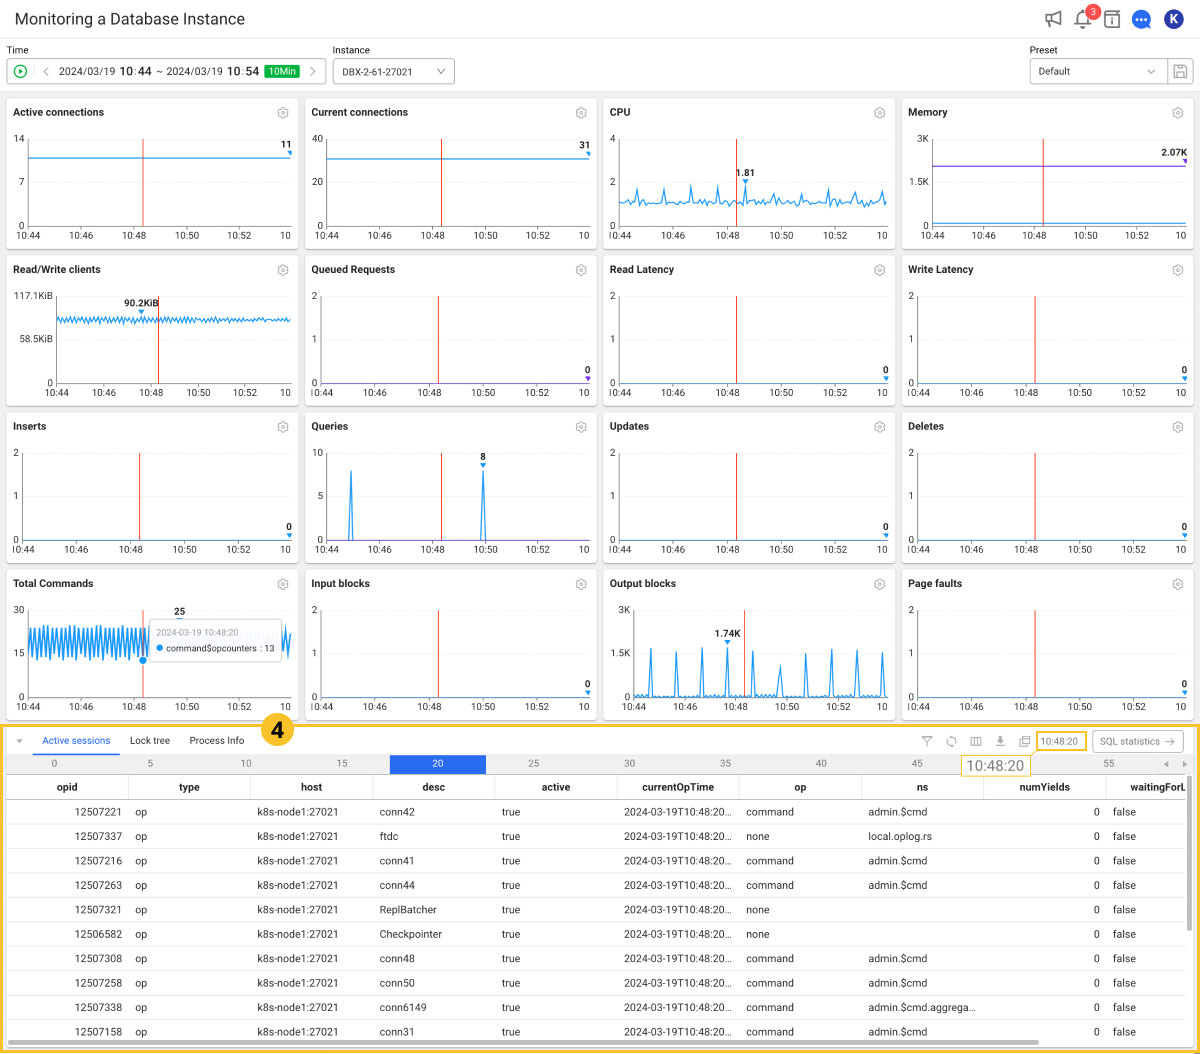
![]() Active Sessions / Lock Tree / Process Info
Active Sessions / Lock Tree / Process Info
-
Active sessions
You can view the sessions running in real time. For more information, see the following.
-
Lock tree
You can see the lock session information, and holder and waiter information in real time. For more information about the table columns, see the following.
-
Process Info
You can query the resource usage of the database server in real time.
-
In the table list, the text colors are changed black → orange → Red, which means that the performance of the session is getting slower.
-
The Process Info can be checked only when the XOS agent has been installed. For more information, see the following.
Selecting metrics
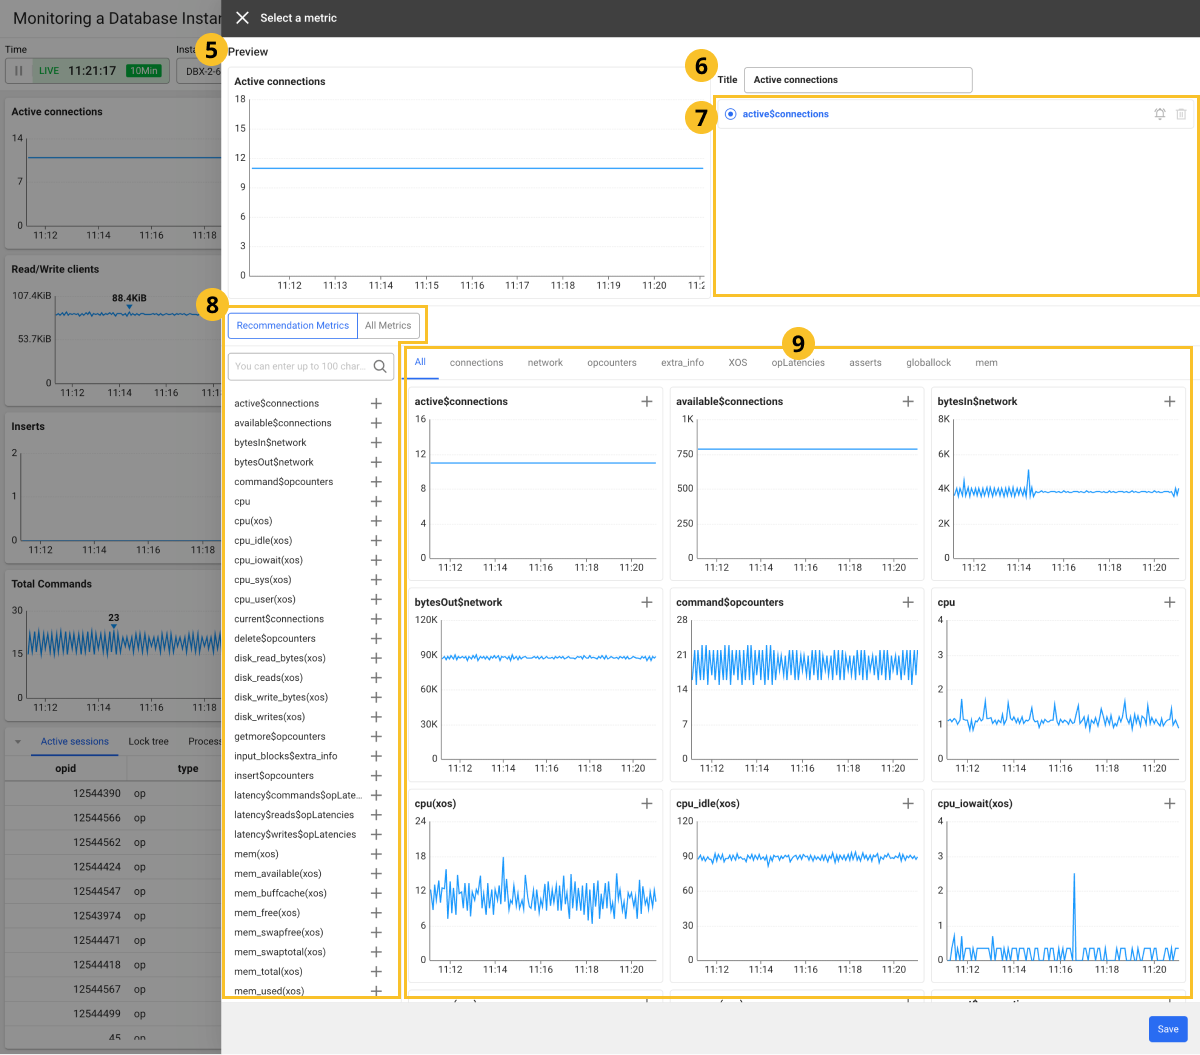
To add or replace the metric graph to the widget, select ![]() on the upper right of the widget. The Select a metric window appears. After completing the desired settings, select Save.
on the upper right of the widget. The Select a metric window appears. After completing the desired settings, select Save.
-
 Preview: You can preview the graph for the selected metric.
 -
 Title: Enter the widget name.
 -
 It displays the metrics displayed on the chart of the selected widget. You can select up to 4 metrics.Note
When you select
 on the right of a metric, the Event Configuration
 Newmenu appears, where you can configure the alerts based on the metric. -
 Recommendation Metrics / All Metrics: If you select Recommendation Metrics, the list of frequently viewed metrics in Database Monitoring appears. The metrics displayed in the list can be changed or added in the widget.
 -
In the
 area, you can see the trend of metrics in a graph and add or change any widget. By selecting a desired tab, you can narrow down the list of metrics according to the category.
Adding metrics
Multiple metrics can be added in a widget. You can add up to four metrics.
-
Select
 on the upper right of the widget to add the metrics in.
 -
If the Metric Select window appears, in the
metrics list or graph list, select  on the right of the metric to add.
 -
To add more metrics, repeat the step 2.
-
To easily identify the widget, change the
Title. -
Select Save on the lower right of the screen.
Charts are generated as many times added to the widget to which metrics are added. If you select ![]() next to the widget name, you can see the name and description of the added metric. You can also check the figure through a tooltip by hovering your mouse over the chart.
next to the widget name, you can see the name and description of the added metric. You can also check the figure through a tooltip by hovering your mouse over the chart.
The tooltip of the ![]() button is not supported in multiple languages.
button is not supported in multiple languages.
Changing a metric
You can change a metric in the widget to another.
-
Select
on the upper right of the widget to change the metrics. -
If the Metric Select window appears, select a metric to change in the
area. -
In the
metrics list or graph list, select a desired metric. -
In the
area, check that the name of the selected metric has been changed. -
Select Save on the lower right of the screen.
Deleting a metric
You can delete unnecessary metrics while multiple metrics have been set in the widget.
-
On the upper right of the widget to delete metrics from, select
. -
If the Metric Select window appears, select
 on the right of the metric to delete from the area.
 -
Select Save on the lower right of the screen.
At least one metric must be selected for a widget. You cannot delete all metrics in a widget.
Preset
You can save and recall user-defined widget settings and active session table arrangements as presets. The Default preset cannot be modified.
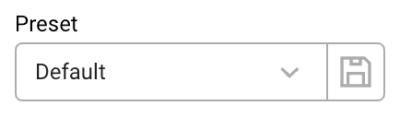
Save Preset
-
Add or modify the widget metrics.
-
On the upper right of the screen, select
 .
. -
In Save preset, change the name and then select Save.
In the Preset list, select a saved item to fetch the settings.
-
The Default preset cannot be modified.
-
You can create custom presets up to 5. Including the modified metric graph, the column order, column width, and filter application content of the active sessions are also applied.
Deleting presets
If you select Preset on the upper right of the screen, the preset list appears. Select ![]() on the right of the preset to delete.
on the right of the preset to delete.
Using the active session section
Through Active sessions at the bottom of the screen, you can see the real-time active sessions. The following provides the guide for the button on the upper right of the table.
 : Using the column header entries in the table, the list can be filtered.
-
 : The list of tables is refreshed.
 -
 : The column header entries in the table can be displayed or hidden.
-
 : You can download the content of the table as a CSV file.
 -
 : A new window appears to see the list on a wider screen.
Zooming in the graph chart section

If the current screen is small and difficult to check the widgets, you can see the graph chart widget on a wider screen. Select ![]() at the bottom of the Active sessions section. The Active sessions section is collapsed and the graph chart widget section is expanded.
at the bottom of the Active sessions section. The Active sessions section is collapsed and the graph chart widget section is expanded.
To zoom out the graph chart widget, select ![]() at the bottom of the Active sessions section.
at the bottom of the Active sessions section.
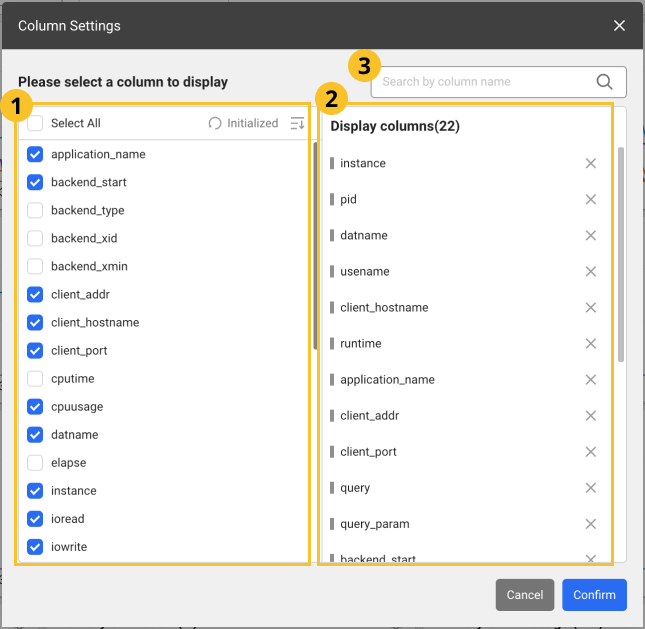
Setting the table columns
You can hide the table header columns or add any of them. You can also change the column order. Select ![]() .
.
-
After configuration, select Confirm to apply the settings in the table.
-
In the
 search bar, enter text to search the desired columns. Only the columns that meet the entered text are displayed.
 -
Images may differ depending on the product, project, or menu.
Adding columns
From the ![]() list, select the items to add as table header columns. To select all items, select Select All.
list, select the items to add as table header columns. To select all items, select Select All.
Deleting columns
From the ![]() list, unselect the columns to delete. Alternatively, select
list, unselect the columns to delete. Alternatively, select ![]() on the right of the item to delete from the
on the right of the item to delete from the ![]() list.
list.
Changing the column order
Drag an item to reposition from the ![]() list, and then move it to the desired position.
list, and then move it to the desired position.
Initializing the configuration
To cancel all changes and reset them, select ![]() Initialized.
Initialized.
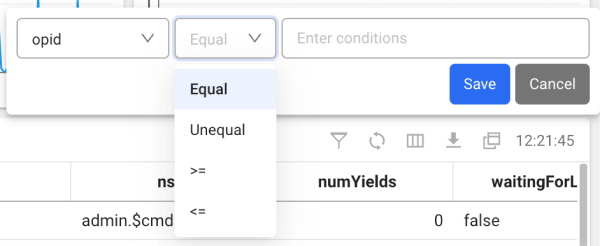
Filtering the table data
-
Select
on the upper right of the table. -
Select a column header and a condition in the table.
-
Enter a desired value in the Enter conditions field.
-
Select Save.
Column information guide
- Active session
- Lock tree
- Process information
The following lists the columns in the table displayed for the Active sessions section. The data is collected using the currentOp.
| Item | Description |
|---|---|
opid | Unique identifier of the operation |
type | If the value is op, the operation type can be viewed in the op field. |
host | Server name |
desc | Description of the client including connectionId |
active | If the operation starts, the value is true and if it is idle, the value is false. |
currentOpTime | Start time of the operation |
op | operation type (none, update, insert, query, command, getmore, remove, etc.) |
ns | The name of the namespace appears with Database or Collection. |
numYields | Number of executed operations |
waitingForLock | If the operation is waiting for lock, the value is true and if it has acquired lock, the value is false. |
waitingForFlowControl | If the operation is waiting for flowcontrol, the value is true. |
| Item | Description |
|---|---|
holder type | Type of the holder session (transaction ID, tuple, etc.) |
lock mode | holder_mode (exclusive lock, shared lock, etc.) |
waiter type | Type of the waiter session (transaction ID, tuple, etc.) |
lock request | waiter_mode (exclusive lock, shared lock, etc.) |
The following items are the metrics collected if the XOS agent has been installed.
| Item | Description |
|---|---|
cputime | CPU usage time |
cpuusage | CPU Utilization |
elapse | Elapsed time of CPU usage |
vsize | Virtual memory size (Kb) |
rss | Resident Set Size (RSS) that is the number of physical pages associated with the process. |
state | Process status |
ioread | Actual time spent reading the block (milliseconds) |
iowrite | Actual time spent writing the block (milliseconds) |
pss | Process specific memory usage + Percentage of shared memory occupied by one process |
uid | user id |
cmd | Executing command |
longcmd | Full path of cmd |