Log setting
Home > Select Project > Log > Log Configuration
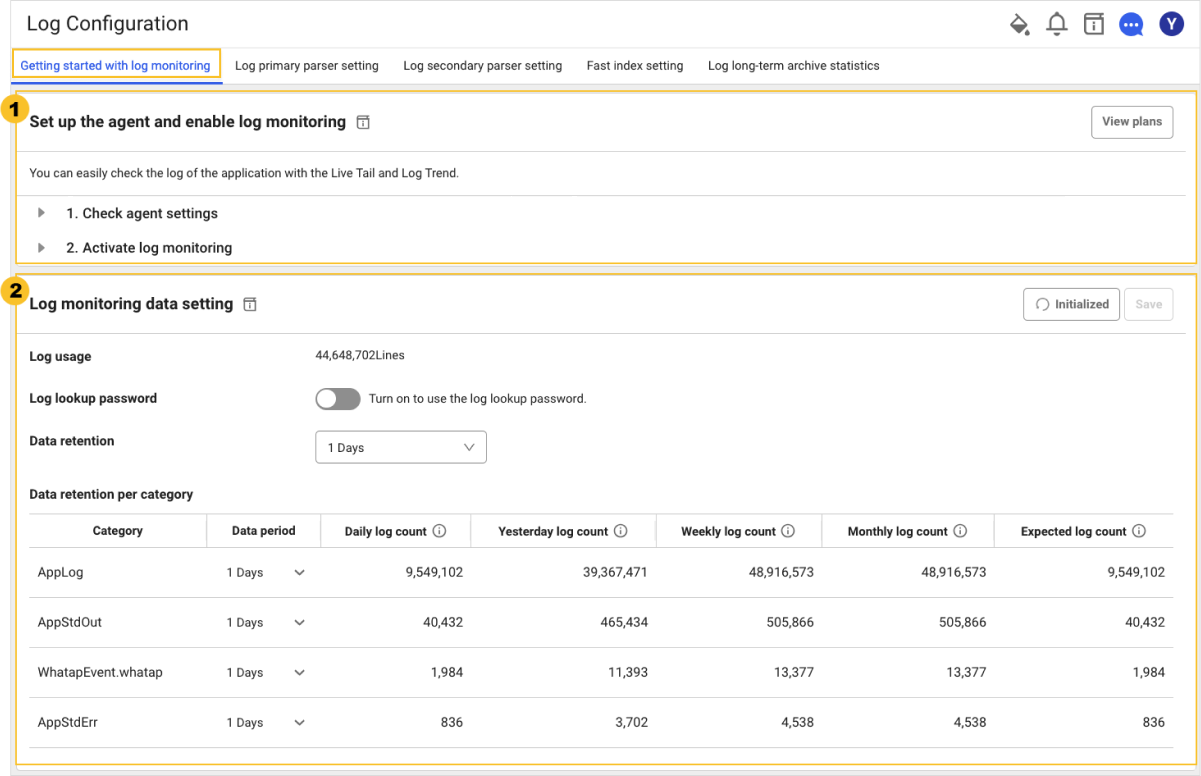
You can configure the log monitoring related settings in Log Configuration. Using the tab at the top, you can use menus for checking the agent settings, determining whether to enable log monitoring, setting the log data retention period and lookup password, registering the log parser, and setting the quick indexes.
-
To use the Activate log monitoring function, the Edit project role is required.
-
The Log edit role allows you to modify the Log Configuration menu other than Activate log monitoring.
Starting the log monitoring
At the top, select the Getting started with log monitoring tab. If you select the ![]() View guide icon and the View plans button, the corresponding guide screen appears.
View guide icon and the View plans button, the corresponding guide screen appears.
Set up the agent and enable log monitoring
In the ![]() area, check the agent settings, and then click the Activate log monitoring toggle button to set whether or not to enable the log monitoring.
area, check the agent settings, and then click the Activate log monitoring toggle button to set whether or not to enable the log monitoring.
Check agent configuration
Check the agent version and settings to start the log monitoring. Select Check Agent Configuration to follow the onscreen instructions.
-
Server Monitoring
Under Apply, check the application guides for each application. See the following guides: Java, PHP, Node.js, Python, Go.
-
DB Monitoring
Under Apply, check each individual application guide. See the following. According to the instructions, add the settings for the log monitoring target file in whatap.conf.
-
Kubernetes Monitoring
Under Apply, check each individual application guide. See the following.
Activate log monitoring
Select Activate log monitoring to set whether or not to enable the log monitoring.
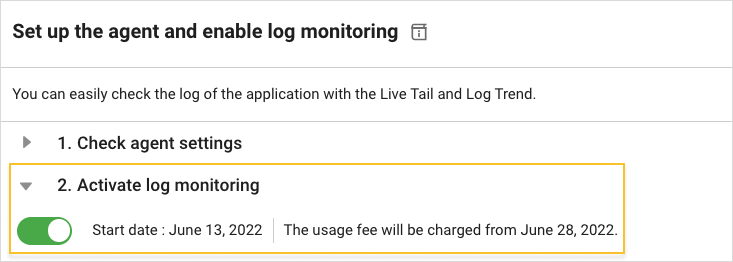
- If you turn on the
 toggle button, the log monitoring is enabled. You can try it for free for 15 days from the activation date.
 - If you turn off the
 toggle button, the log monitoring is disabled. Logs are no longer saved.
Log monitoring data setting
In the ![]() area, you can see the Log usage. You can also change the Log retention period and Log lookup password settings.
area, you can see the Log usage. You can also change the Log retention period and Log lookup password settings.
Log retention period
This is the default data retention period to be applied commonly. If not specified, the default value is 1 day. In addition to the option to select a log retention period, you can enter a desired period of time. If not set separately in the Log usage list, this log data retention period is applied by default. If you set the data retention periods for each category in the Log usage list and select Initialized, the default data retention period is reset.
Log usage amount
You can specify the log data retention periods for each category in the Log usage list. Log Count means the number of logs stacked for the period. For example, Daily log count is the number of logs accumulated during the day, and Expected log count is the number of logs of the today's log count multiplied by the days of data retention.
You can specify the log data retention period as follows. You can free the space by deleting old data according to the specified period.
-
Trial Project
You can select 1, 2, or 3 days for the data retention period.
-
Paid Project
For the data retention period, you can select one of 1 day, 2 days, 3 days, 4 days, 5 days, 6 days, 7 days, 10 days, 30 days, and 40 days.
-
Data size-based billing
The price differs depending on the data retention period.
For example, if an average of 2 million logs per day accumulates and the data retention period is set to 3 days, an average of 6 million logs is kept on the collection server and subject to billing.
Log lookup password
To enhance security, set the Log lookup password. The log lookup password is optional. If you are using a log lookup password, enter the password to go to the log screen.
In case you forgot the password
If you have the Edit Log role, you can modify it with a new password in Log Configuration.
Log primary parser setting
At the top of Log Configuration, select the Log primary parser setting tab to register and modify the log parser. The log primary parser provides the parsers for GROK and JSON. From the collected logs, the key data that matches the pattern conditions (search key and search value) is extracted. The parsed log keys are used for categorizing log types and indexing to search for specific logs. The parser is required to register for aggregating log occurrence counts by type or quickly finding specific logs.
-
GROK: This parsing is based on the regular expression by default. It provides parsing based on the reserved keywords.
-
JSON: Batch parsing is provided for the JSON output parts of the logs.
In case of no parsing logic registered, keys for search
category, oid, oname, okind, okineName, @txid, @login, httphost
Reserved words that cannot be registered for the parser
For the following reserved words, indexes are not created even if a parser has been registered.
timestamp, message, pcode, category, content, logContent
For more information about the log parser, see the following.
Setting item
| Set value | Description | ETC |
|---|---|---|
| Category | Category to apply the pattern to | required |
| Log detection condition | Enter the search key and search value to be applied as the filter. The pattern is applied only to the log data that meets the log detection conditions. If you do not enter any log detection condition, the pattern is applied to all logs. | optional |
| Pattern | It is the pattern to parse the log for. Parsing is performed according to the created pattern, and indexes are created. It supports GROK, regular expression syntax. | required |
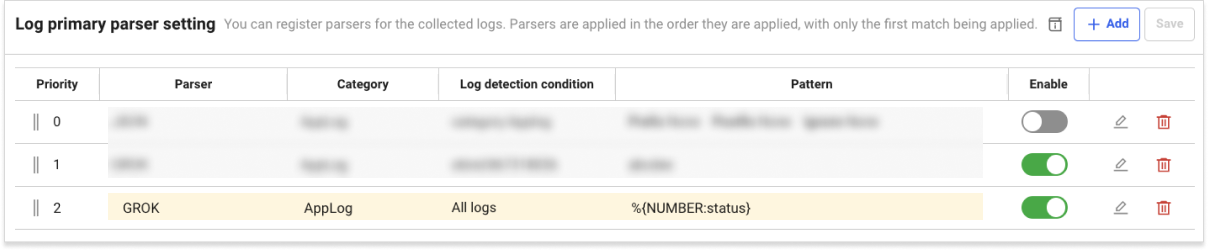
Parser list
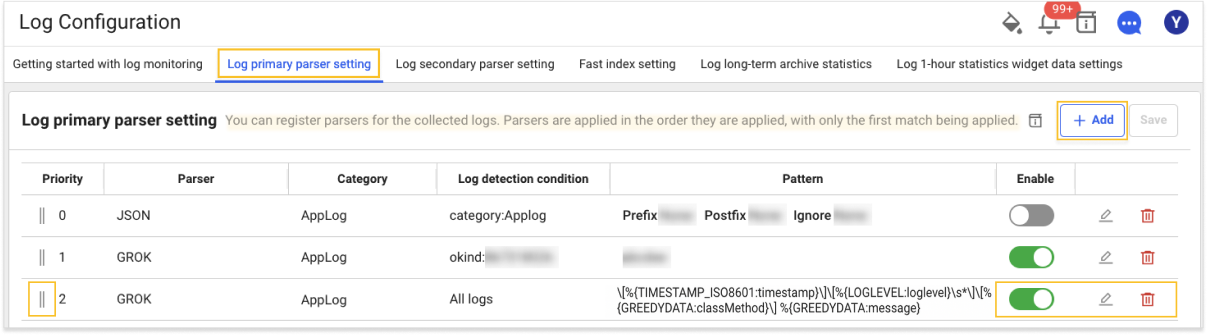
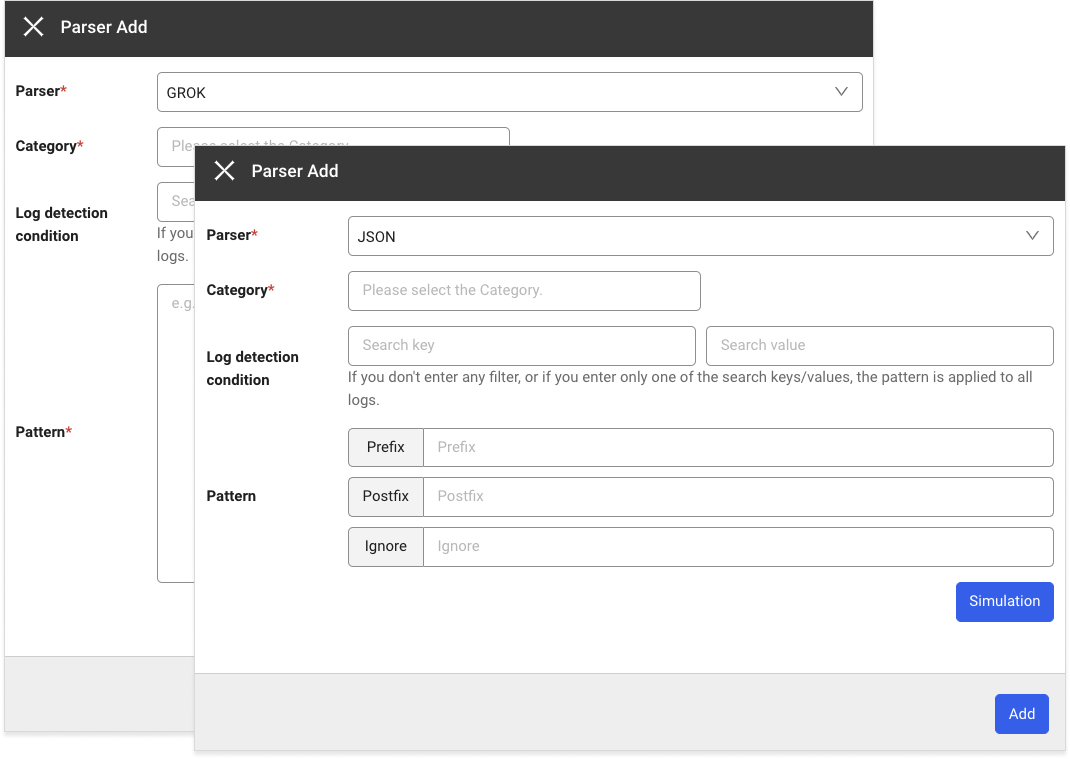
If you select the Log primary parser setting tab at the top of Log Configuration, you can see the Parser List screen where you can search for registered parsers and add or edit them.
-
If you select + Add on the upper right, the Parser Add window appears.
-
You can change the order of parser settings by dragging the
 icon in the Priority column of the parser list.
 -
Through the parser list's
Enable toggle button, you can set whether or not to enable the parser. -
Through the parser list's
 Edit and
  Delete icons, you can modify or delete the registered parser.
Parser registration order
At the top of Log Configuration, select the Log primary parser setting tab to register and modify the log parser. The following shows the common parser registration procedure.
-
If you select + Add, the Parser Add window appears.
-
In the Parser selection window, select a parser. For more information about the registration of each parser and pattern, see the following.
-
When you select Register pattern, the pattern registration and simulation window appears on the right.
-
Enter values for Pattern and Log for registration.
-
To check whether the pattern is normal, click Simulation and then measure the performance of simulation and pattern.
-
After applying the pattern, select a category in the Category selection window or directly enter it.
-
Select a Search key and Search value for the Log detection condition or directly enter them.
-
Select Add to add a parser.
-
For more information on simulation and performance measurement, see [the following] (#parser-simulation-and-performance).
-
When registering the log parser, parsers cannot be registered repeatedly in the same Category.
-
The pattern is applied only to the log data that meets the filter conditions. If Log detection condition is not specified, the pattern is applied to all logs.
GROK parser pattern registration
The default syntax is %{SYNTAX:SEMANTIC}. For more information about the GROK parser, see the following. Pattern registration and simulation are required.
-
SYNTAX
GROK definition pattern.
-
SEMANTIC
It is the key allocated to the parsed data.
NoteIt is recommended to use combination words in SEMANTIC so that reserved words are not used.
Registering the JSON format parser pattern
If all or part of a log is output in JSON format, you can parse the JSON output through the JSON format parser. To detect the JSON output of the log, the prefix and postfix options are combined to specify which part of the log to be recognized by JSON for parsing. For more information about the JSON parser, see the following. Simulation is required.
| Option | Description |
|---|---|
| Prefix | Specify the string before the beginning of JSON string. If not specified, it is identified as a JSON string from the beginning of the log output. |
| Postfix | Specify the string after the end of JSON string. If not specified, it is identified as a JSON string up to the end of the log output. |
| Ignore | Specify fields in the JSON output to exclude from key extraction. |
-
Registration example
Log[2022-10-25 10:15:34:145]...(line feed)
Request : {"key1":"value1","key2":"value2",...}(line feed)
Response : {"key3":"value3","key4":"value4",...}As in the example, to parse both Request JSON and Response JSON for incoming logs, register the following two patterns.
-
Pattern for request parsing
Strings between "Request : " and "Response"
{"key1":"value1","key2":"value2",...} -
Pattern for response parsing
Strings from "Response : " to the end of a log
{"key3":"value3","key4":"value4",...}
-
-
JSON custom pattern registration
If part of a log is output in JSON format, the JSON output can be parsed by a dedicated custom parser. Enter the pattern as follows:
io.whatap.logsink.parser.JsonFormatParser{}To detect the JSON output of the log, the prefix and postfix options are combined to specify which part of the log to be recognized by JSON for parsing.
Specify an option in
{}ofJsonFormatParser{}.-
Registration example
Log[2022-10-25 10:15:34:145]...(line feed)
Request : {"key1":"value1","key2":"value2",...}(line feed)
Response : {"key3":"value3","key4":"value4",...}As in the example, to parse both Request JSON and Response JSON for incoming logs, register the following two patterns.
- Pattern for request parsing
Strings between "Request : " and "Response"
{"key1":"value1","key2":"value2",...}
io.whatap.logsink.parser.JsonFormatParser {prefix:"Request : ",postfix:"Response"}- Pattern for response parsing
Strings from "Response : " to the end of a log
{"key3":"value3","key4":"value4",...}
io.whatap.logsink.parser.JsonFormatParser {prefix: "Response : "} - Pattern for request parsing
-
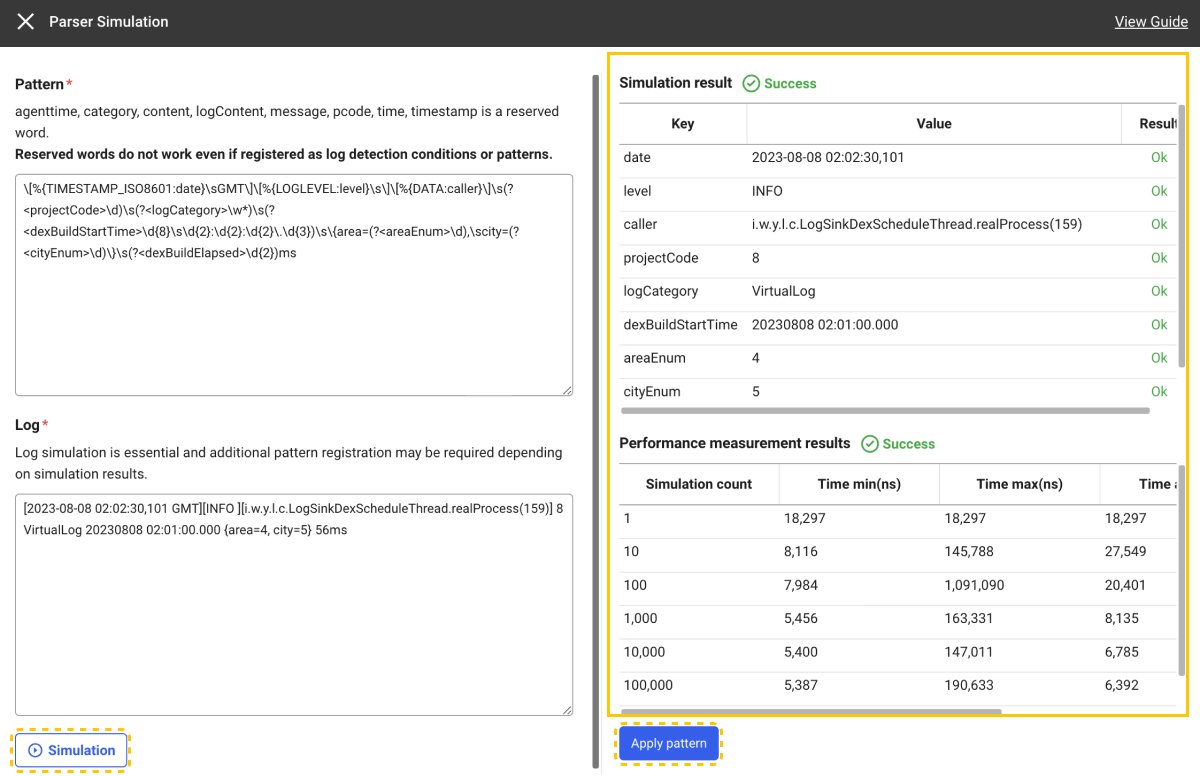
Parser simulation and performance measurement
-
Enter values for Pattern and Log.
-
Click Simulation to check whether the parsing has been successful with the pattern to register.
-
If the simulation is successful, you can view Simulation result and Performance measurement results.
-
When you click Apply pattern after simulation, the pattern that has been entered for the selected parser is applied.
-
Performance measurement measures the time taken by the parser to perform repeated parsing on the target string for simulation.
-
After parser simulation, you can register a pattern.
Parsing success
If a key is generated by registering a parsing logic, the value parsed with the key is added upon log inquiry. As in the following Live Tail menu's example, the parsed key and value are added.

The parsed key can be checked in Live Tail, Log Search, and Log Trend.
Log secondary parser setting
At the top of Log Configuration, select the Log secondary parser setting tab to register and modify the log parser. The 4xx, 5xx status code parser and Status code success rate parser are provided. The log secondary parser can be used if a primary parser such as GROK or JSON has been parsed. By processing the values extracted by the primary parser, the statistics data is generated. Secondary statistics are extracted based on HTTP status codes for the web or API response logs.
-
4xx, 5xx status code parser: The counts are aggregated for abnormal responses.
-
Status code success rate parser: The percentage of abnormal responses to the total number of cases is extracted.
The log secondary parser provides the special purpose secondary parsing function for the primary parsed results. To use the secondary parser, the primary parser must have been registered.
Parser list
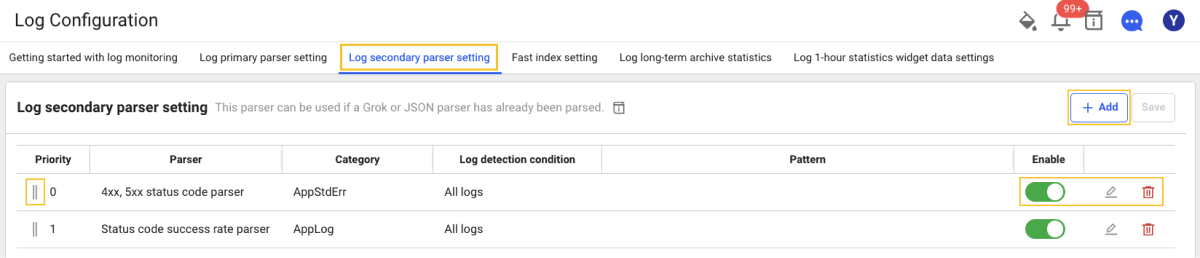
If you select the Log secondary parser setting tab at the top of Log Configuration, you can see the Parser List screen where you can search for registered parsers and add or edit them.
-
If you select + Add on the upper right, the Parser Add window appears.
-
You can change the order of parser settings by dragging the
icon in the Priority column of the parser list. -
Through the parser list's
Enable toggle button, you can set whether or not to enable the parser. -
Through the parser list's
Edit and Delete icons, you can modify or delete the registered parser.
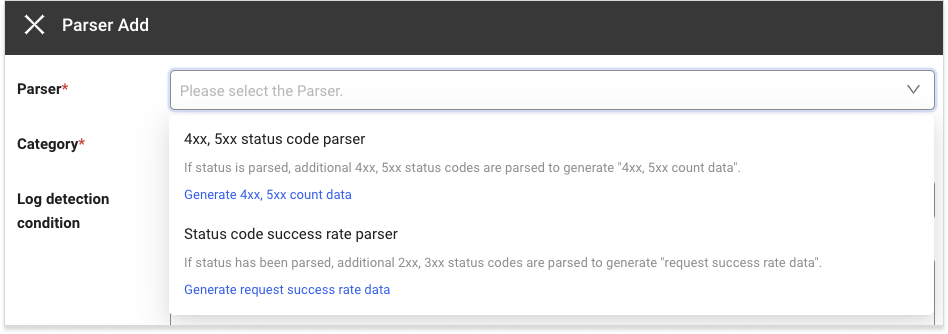
Parser registration order
At the top of Log Configuration, select the Log secondary parser setting tab to register and modify the log parser. The following shows the common parser registration procedure.
-
If you select + Add, the Parser Add window appears.
-
In the Parser selection window, select a parser. For more information about the registration of each parser settings and status codes to exclude, see the following.
-
4xx, 5xx status code parser Registration of settings and status codes to exclude
-
Status code success rate parser Registration of settings and status codes to exclude
-
-
Enter the Status codes to exclude.
-
In the Category selection window, select a category or enter it.
-
Select Log detection condition or enter it.
-
Select Add to register a parser.
Registration of status codes to exclude for the 4xx, 5xx status code parser
The 4xx, 5xx status code parser can be used when the status has already been parsed. Additional 4xx and 5xx status codes are parsed using the parsed status. You can create 4xx and 5xx counts with the parsed data. For the status codes to exclude, you can enter or select the 4xx, 5xx status codes. The entered status code is excluded upon parsing the 4xx, 5xx status codes from the logs.
Setting item
| Set value | Description | ETC |
|---|---|---|
| Category | It is the category to generate the 4xx, 5xx count data. | required |
| Log detection condition | Enter the search key and search value to be applied as the filter. The 4xx, %xx count data is generated only for the log data that meets the log detection condition. If you do not enter any log detection condition, the data is generated for all logs. | optional |
| Status codes to exclude | The status codes to exclude upon generation of statistics data. If no entry, the 4xx, 5xx count data is generated for all error status codes that correspond between 4xx and 5xx. | optional |
Registration example for the status parser
If the incoming log is {"msg":"message","status":404} and its status is parsed by the GROK parser as shown in the example, it is parsed as status: 404. If you confirm that the status has been normally parsed, register the status codes to exclude by the 4xx, 5xx status code parser.
Data Search
If all parsers have been registered, go to Integrated Flex Board and then create the Log 4XX, 5XX count widget.
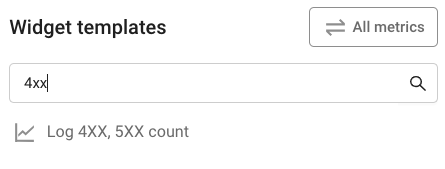
If the widget is created, you can see the following data.
-
avg: Average value of the data during the query period
-
max: Maximum value of the data during the query period
-
recently: Final value of the data during the query period
Registration of status codes to exclude by the status code success rate parser
The Status code success rate parser can be used when the status has already been parsed. For more information about status parsing, see the following. Additional 2xx and 3xx status codes are parsed using the parsed status. HTTP request success rate data can be generated using the parsed data. For the status codes to exclude, you can enter or select the 2xx, 3xx status codes. The entered status code is excluded upon parsing the 2xx, 3xx status codes from the logs.
Setting item
| Set value | Description | ETC |
|---|---|---|
| Category | It is the category to generate the request success rate data. | required |
| Log detection condition | Enter the search key and search value to be applied as the filter. The request success rate data is generated only for the log data that meets the log detection condition. If you do not enter any log detection condition, the data is generated for all logs. | optional |
| Status codes to exclude | The status codes to exclude upon generation of request success rate data. If no entry, the request success rate data is generated for all success rate status codes that correspond between 2xx and 3xx. | optional |
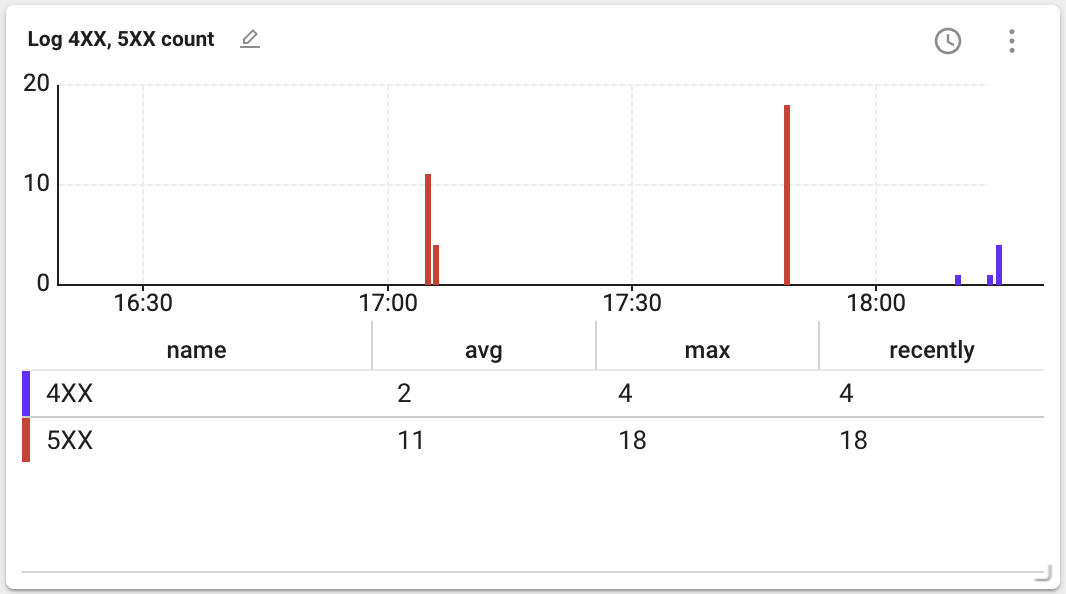
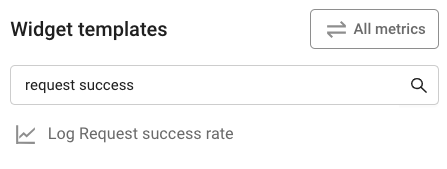
Data Search
If all parsers have been registered, go to Integrated Flex Board and then create the log request success rate widget.
If the widget is created, you can see the following data.
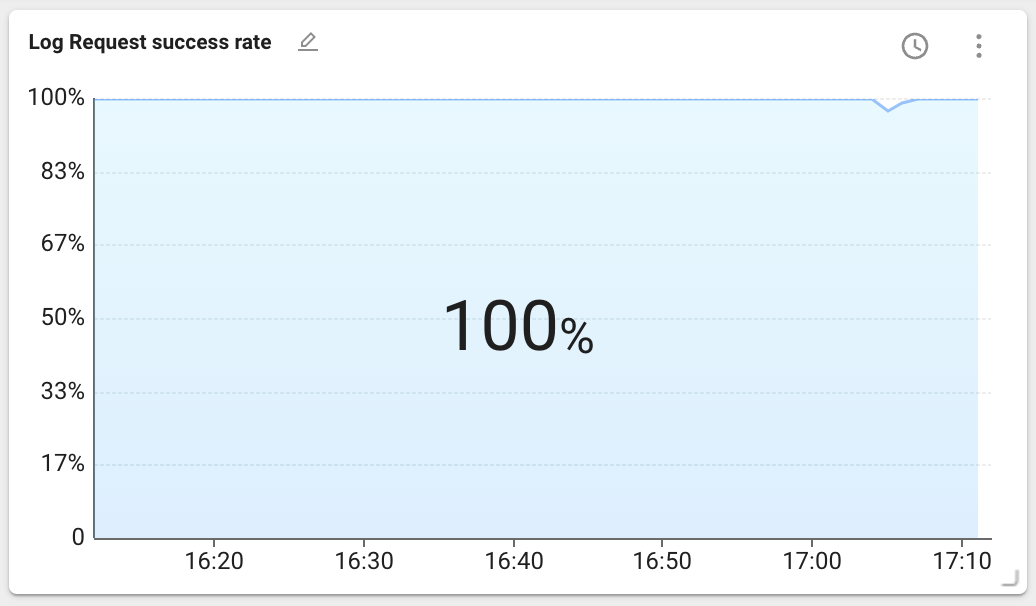
The data above the chart represents statistics for the lookup period. You can select the statistical method with the latest value, maximum value, or average value. The latest value is selected by default.
Fast Index Setting
Select the Fast index setting tab at the top of Log Configuration. Collecting a large number of logs can significantly decrease the log search performance. The frequently used search conditions are created as index, you can improve the log search performance for quick search. The setting items are as follows:
| Set value | Required | Description |
|---|---|---|
| Category | Mandatory | Category to be set as fast index |
| Search Key | Mandatory | Search key for fast index setting |
| Case insensitive | Option | Whether to be case sensitive |
| Rule | Mandatory | * must be included at least one. |
| Enabled | Mandatory | Active or inactive (default value is true) |
Importing/exporting log settings
You can save common parser settings and Fast index setting content in JSON file format, and apply them by importing a JSON file from other projects. You can reduce the hassle of creating the settings repeatedly for each project.
-
Add parser settings and Fast index setting to one project.
-
Select JSON
 on the upper right of each configuration tab.
 -
On the upper right of the Export JSON window, select Export.
-
The JSON configuration file is saved on your PC.
-
Move to another project and then go to the Log > Log setting menu.
-
Select the configuration tab where you have exported the JSON configuration file before, and then select
 .
. -
If the file selection window appears, select the JSON configuration file saved on your PC.
-
If the Import JSON window appears, check the configuration file and then select Add to list or Overwrite.
-
Select Save on the upper right of the screen.
After importing the JSON configuration file, you cannot save the imported settings unless you select Save.
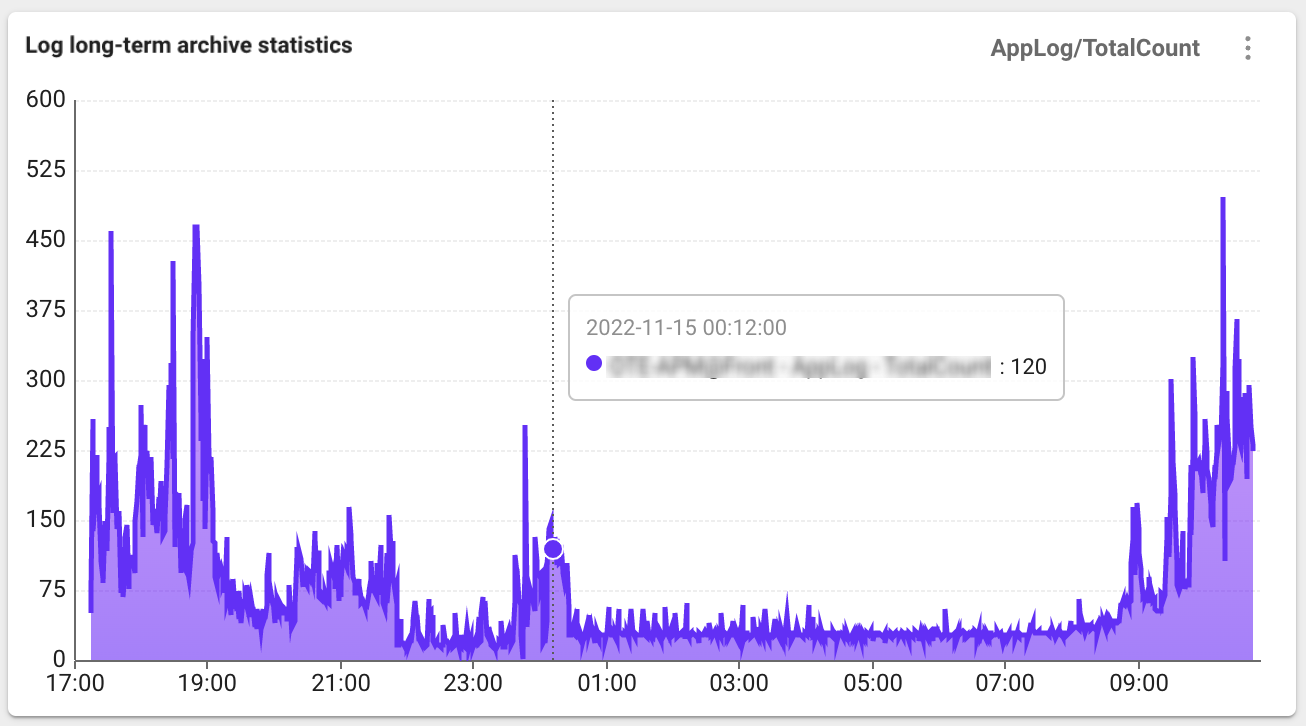
Log long-term archive statistics
Select the Log long-term archive statistics tab at the top of Log Configuration. Log data is so large and difficult to retain for a long time. Using the Set log statistics data function, you can save information on how many logs that meet specific conditions are collected every 5 minutes. Even if actual log data has been deleted for a long time, you can check the trend of how many logs that meet the conditions are collected.
Adding the log long-term archive statistics
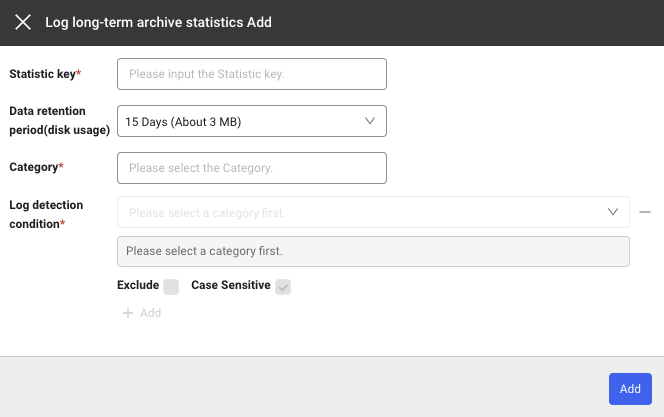
If you select + Add under the Log long-term archive statistics tab, the Log long-term archive statistics Add window appears. You can add rules by using + Add or delete the created rules by using the - icon.
Setting item
| Field | Description |
|---|---|
| Category | Category to apply the rule to. |
| Statistic Key | The same key cannot be set twice to save when a log that meets the rule is generated. |
| Log detection condition | Condition for generating log statistical data. Statistical data is generated based on how many logs that meet this condition are collected. |
| Exclude | If checked, statistical data is generated with values that do not correspond to the entered conditions. |
| Case Sensitive | Specify case sensitivity for the values of the entered log detection conditions. |
| Enabled | Active or inactive (default value is true) |
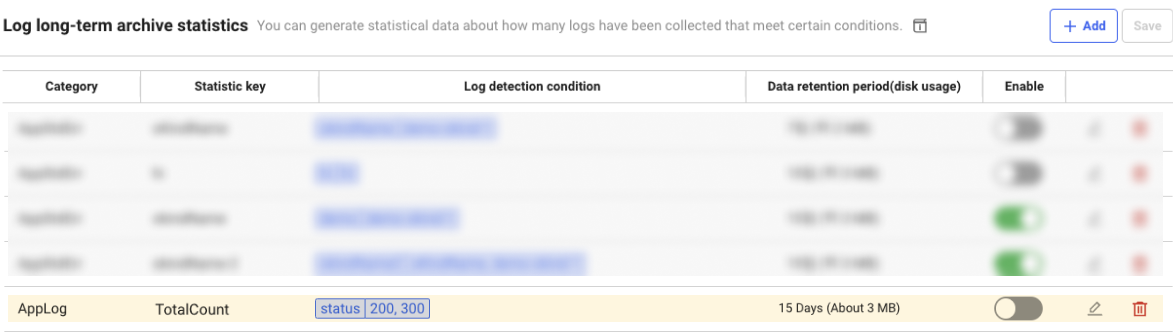
Example
If a setting is added as follows, statistical data is generated with a key value of TotalCount for the logs whose status is 200 or 300.
Data Search
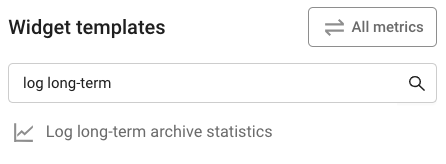
-
Create a widget by searching Log long-term archive statistics in Widget templates of Integrated Flex Board.
-
Enter the Category and Statistic key to view and then select Apply.
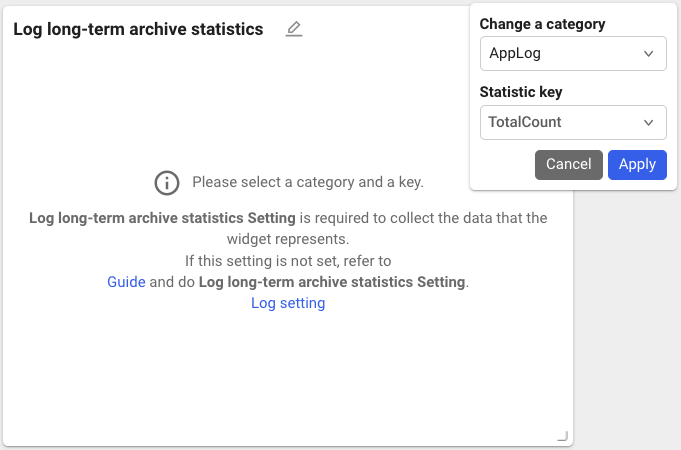
-
With the added settings, you can check the Log long-term archive statistics data as follows.