Log Trend
Without the Log Read role, you cannot enter the menu.
Home > Select Project > Log > Log Trend
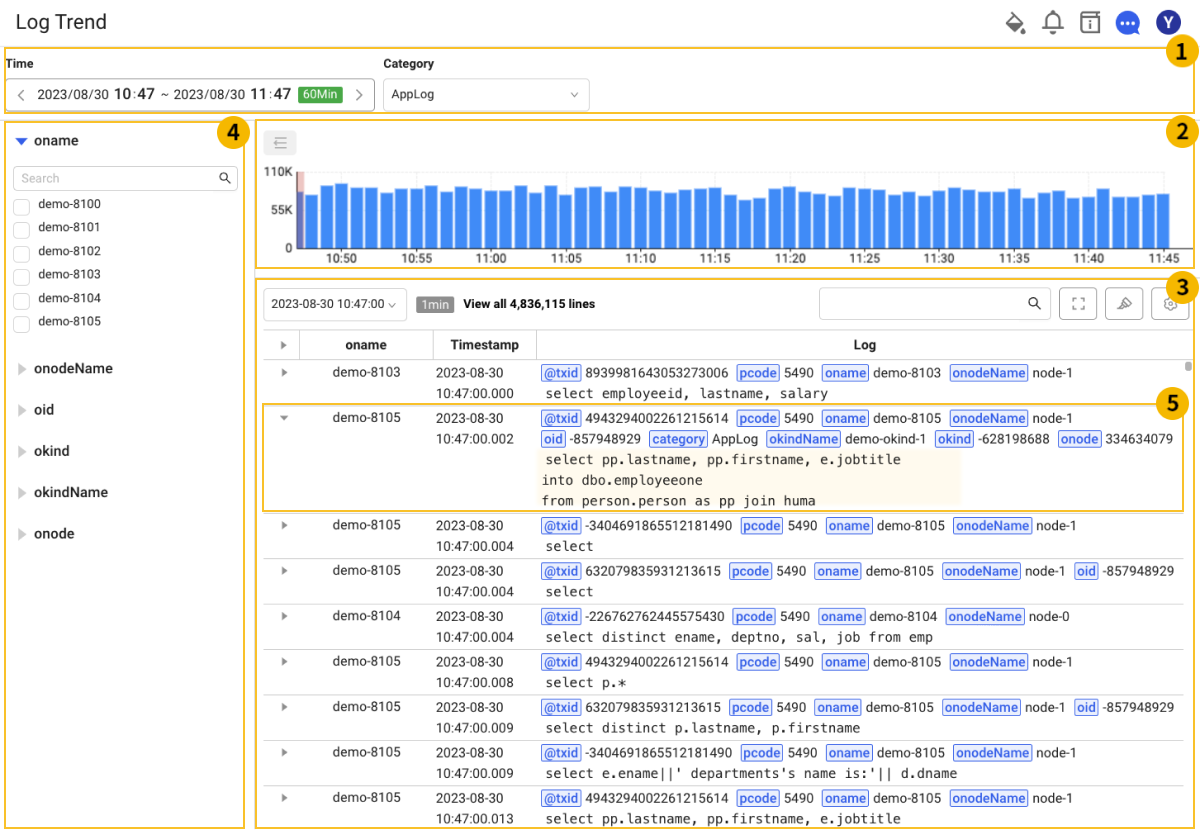
In Log Trend, you can check the occurrence pattern of a specific error type through the number of logs classified by type, and check detailed log data by hour. A highlight feature allows you to quickly identify the desired logs. You can search the trend of logs collected by category.
The major terms are as follows:
- Category: Unit for log collection and inquiry
- Content: Log messages
- Search Key: It is generated through the log parser settings.
- Tag: Key to search the collected logs
Request Data
-
If the scroll reaches the bottom, the next data is retrieved.
-
In
 , specify the time and collection unit, category, of the log data to be searched.
 -
If the category is changed, the logs that correspond to the selected category are searched. You can see the logs in
 bar chart and
  log table.
 -
If you click a bar in
bar chart, the logs are viewed that correspond to the time range of the bar. -
You can see the total number of logs viewed from the upper left of the log table.
-
On the upper right of the
log table, select the  full screen icon, you can see the log and timestamp in the full screen.
 -
 In Side menu, you can see the logs filtered by tags. Up to two search keys can be selected, and multiple search values can be selected.
 -
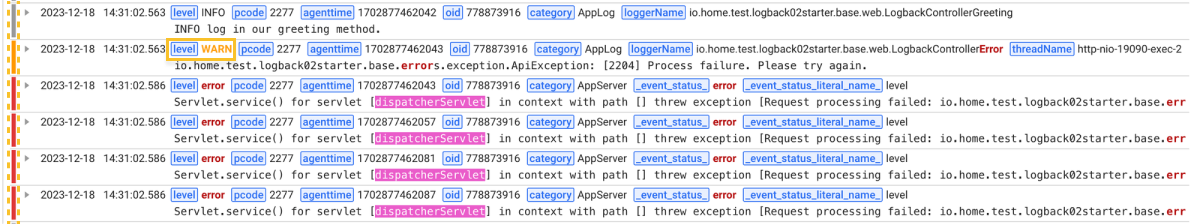
If the agent option is set, the log levels are collected and the colors for each log level appear as follows:
 Note
NoteSetting the agent options
-
The agent options are as follows:
# whatap.conf
weaving=log4j-2.17
weaving=logback-1.2.8 -
In Java agent 2.2.22 or later, it can be used when setting log4j-2.17 or logback-1.2.8 in the weaving setting. It is required to restart the agent.
-
The log level is determined based on the
levelandtypeamong the parsed keywords. When there are keys parsed aslevelandtype, and the parsed values have FATAL, CRITICAL, ERROR, WARN, WARNING, and INFO, the log level color appears.
NoteYou can change the column width by dragging an edge of the log table column.
-
Checking the log content
What is content?
Content means the log messages.
- The first line of the log column is the log's parsed key and value, and the second line is the log's content.
- For each row (log) of the log table, the
 More button exists. If you select the More button, you can check the entire content of the log like
  .
.
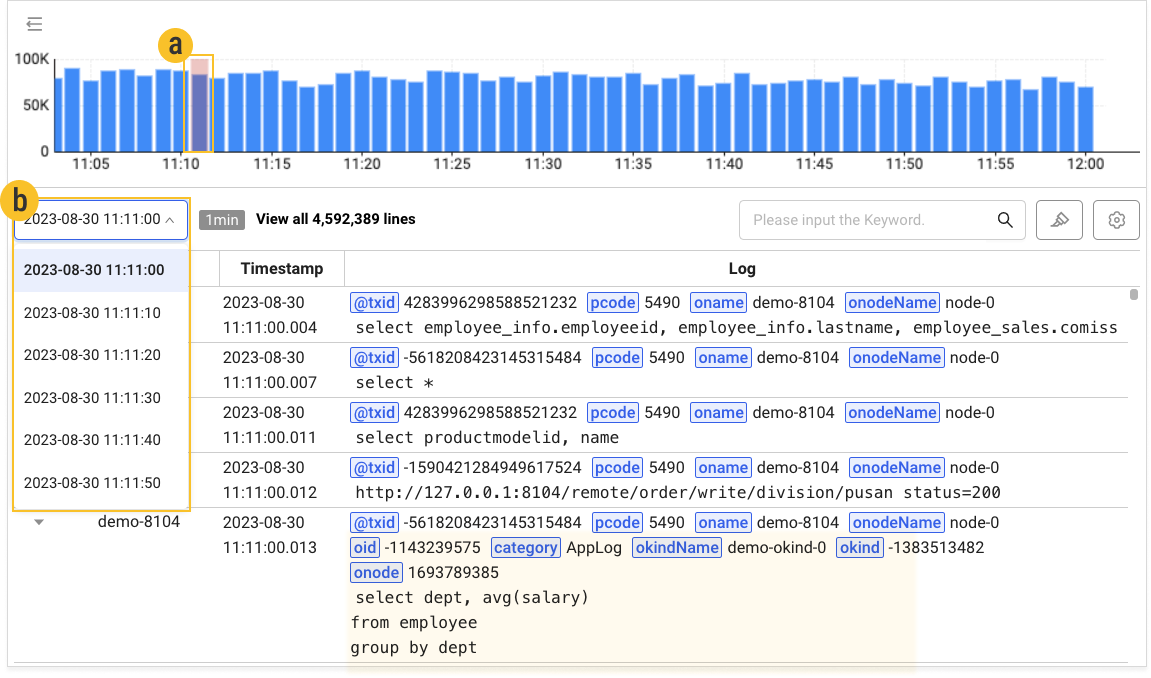
Viewing the logs with a chart
-
You can click a
 desired time on the bar chart to view the logs in the period of time.
 -
You can use the
 time selection option on the upper left of the log table under the bar chart to further refine your log search in the selected time zone:
-
1min: interval (spacing between bars on the chart)
-
Select a time option: Time zone whose time range is divided into 6 segments
-
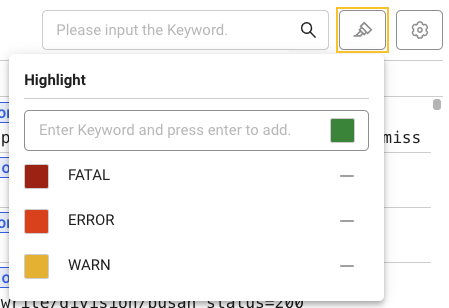
Highlight
-
The highlight function is provided to easily identify the desired keywords.
-
In the input field on the right, enter the keyword to highlight. You can check the highlighted keywords like this.
Setting the table
Column settings
Right of the ![]() area, select
area, select ![]() Column settings. You can add columns or set order.
Column settings. You can add columns or set order.
-
Adding columns
You can add columns to the table by selecting tags. If you unselect the log column, you cannot see Log view detail setting. Be sure to select at least one column.
-
Setting the column order
When you add a column, the column is added to Display columns. Drag a desired column to change the order of the columns.
Log view detail setting
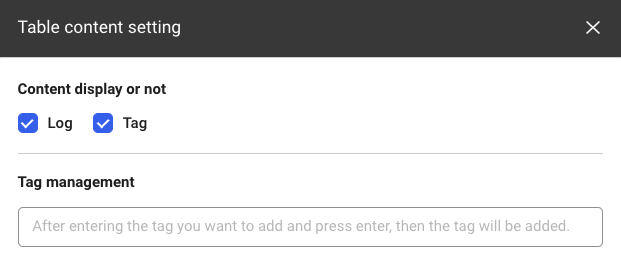
On the right of ![]() , select
, select ![]() Log view detail setting. content and Tag are all checked and two items are also displayed. Be sure to select any of content and Tag.
Log view detail setting. content and Tag are all checked and two items are also displayed. Be sure to select any of content and Tag.
Unchecked items are not displayed in the table. If you deselect the Tag as follows, the log's Tag does not appear in the table.

When you add tags in the Tag management list, the tags in the log are listed in the order you added. You can change the order of the tags by dragging them. f you disable an added tag, the disabled tag does not appear.
-
Column settings and Log view detail setting can be used in Live Tail, Log Search, and Log Trend.
-
In the same project, the Live Tail, Log Search, and Log Trend menus share Column settings and Log view detail setting.