Pod Startup Analysis
Home > Select Project > Analysis > Pod Startup Analysis
Below WhaTap node agent 1.4.2
-
Instead of the new Pod initialization analysis menu, the existing menu (Pod initialization performance) is provided.
-
It can be accessed only in the cluster project (
CP).
JVM-based applications including the springboot may fail the liveness check at initialization by using a large number of resources. If the liveness check fails over a specific number of times, the Pod is deleted and restart is attempted infinitely, which may cause deployment failure.
If you use the Pod Startup Analysis function of WhaTap Kubernetes, by analyzing the peak usage and initialization time at Pod startup, you can get help in setting the optimal initial delay (liveness check exemption time).
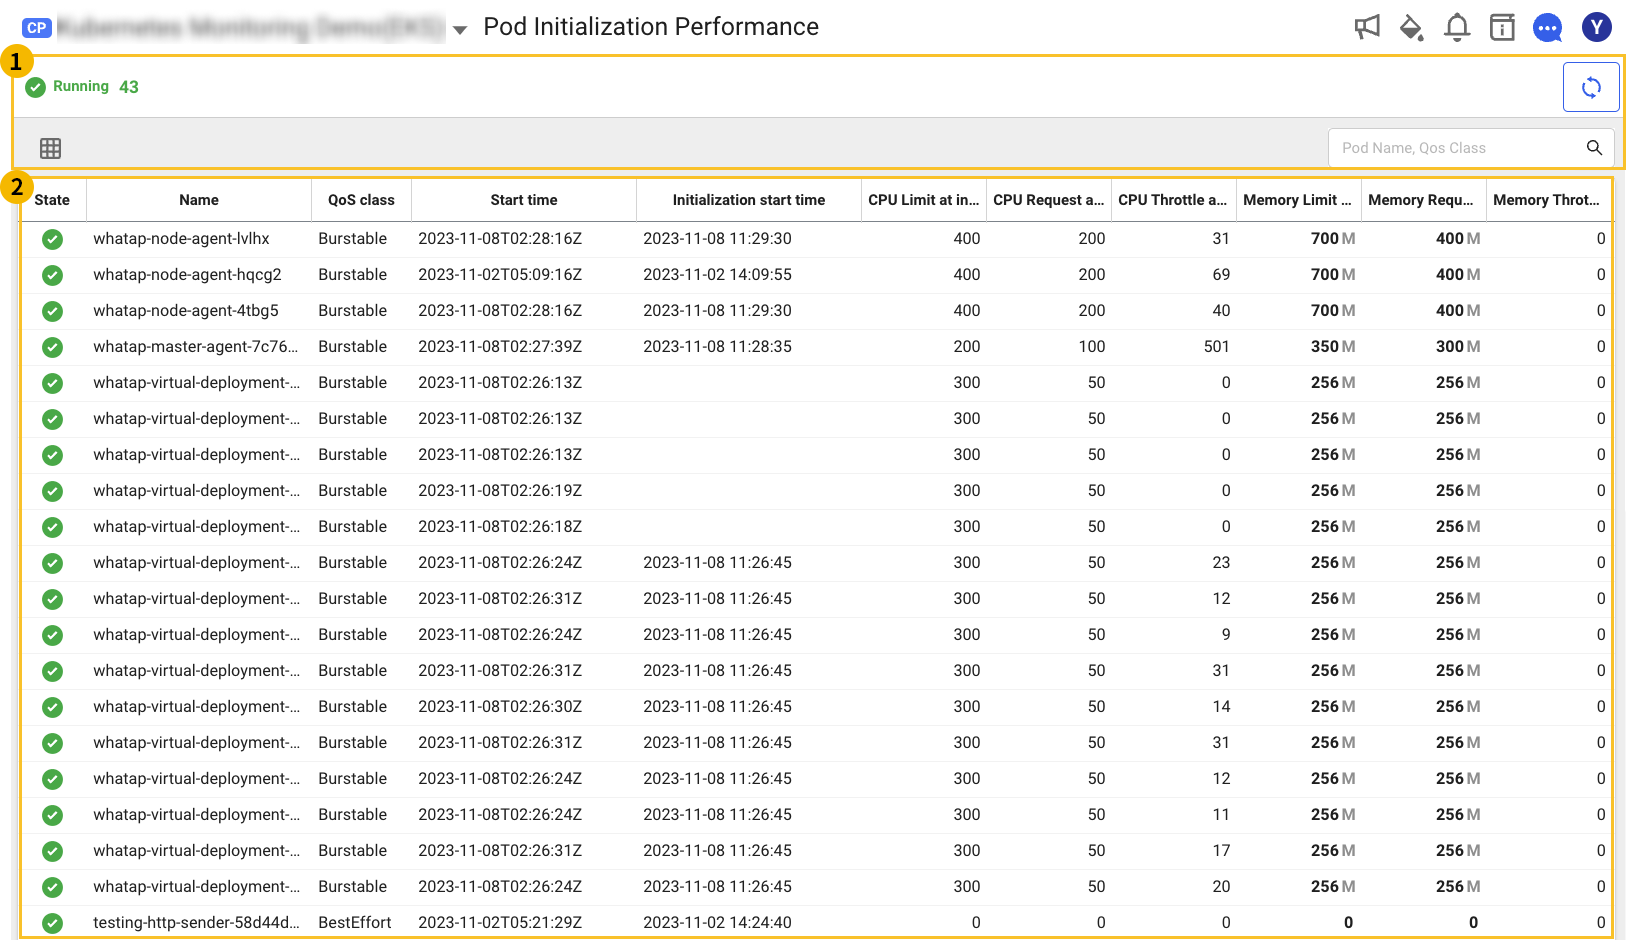
Basic screen guide
-
On the upper left of the
 area, you can see the Pod counts for each status.
 -
You can refresh information by selecting the
 Refresh icon on the upper right of the area.
 -
You can select a column by selecting the
 Select column icon on the left of the area.
 -
In the input field on the right of
area, you can search for the Pod Name or QoS class. -
When selecting a desired column in the
 area, you can sort the list based on the corresponding column.
Column guide
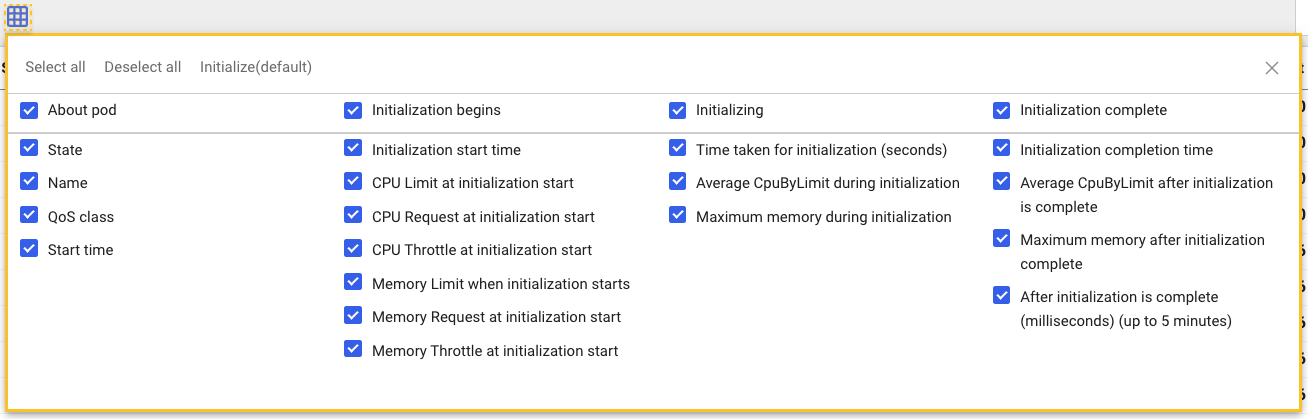
The Pod Startup Analysis list can classify columns according to About pod and Pod initialization timeline as follows:
About pod
You can see the information for Name, State, QoS class, and Start time of the Pod.
-
State: Indicates the life cycle of the Pod.
-
 Pending: Indicates that a Pod start has been approved inside the Kubernetes cluster, but no container has been created.
 -
 Running: Indicates that the Pod is bound to the node, all containers are created, and at least one container is running or starting or restarting.
 -
 Succeeded: Indicates that all containers in the Pod have been successfully terminated and have not been restarted.
 -
 Failed: Indicates that one or more containers in the Pod failed and were terminated.
 -
Unknown icon Unknown: Indicates that communication with the Pod is not possible for some reasons.
-
-
QoS class: The quality of service of the Pod. The QoS class determines the priority of Pods when resources are insufficient. Higher priority Pods are terminated before lower priority Pods.
-
Guaranteed: Most available resources in the node are guaranteed and are assigned priority over other Pods. They are terminated last.
-
This is the case when all containers in the Pod have CPU and memory requests.
-
This is the case when all containers in the Pod have CPU and memory limits and their values are the same as the requests.
-
-
Burstable: The Pod allocates some resources when the node runs out of resources.
-
This is the case when the conditions of the Guaranteed class are not met.
-
This is applied when any of the Pod's containers have requests or limits set for CPU and memory.
-
-
BestEffort: It has lower priority than other Pods because there is no resource request or limit. It is terminated first.
- This is the case when all containers in the Pod have no requests and limits for CPU and memory.
-
-
Start time: Indicates the Pod's start time or created time.
Start initialization
Start initialization indicates the time point when the first metric data has been collected.
-
Initialization start: Indicates the data for the initialization started time. It is the time point of first data collection.
-
CPU limit at start of initialization: Indicates the CPU limit when initialization has started.
-
CPU request at start of initialization: Indicates the CPU request when initialization has started.
-
CPU throttle count at start of initialization: A value that is incremented when the container exceeds the CPU limit at the start of initialization.
-
Memory limit at start of initialization: Indicates the memory limit set when initialization has started.
-
Memory request at start of initialization: Indicates the memory request requested when initialization has started.
-
Memory throttle count at start of initialization: A value that is incremented when the container exceeds the memory limit at the start of initialization.
Initializing
Initializing indicates the previous time point when data with a CpuByLimit value lower than the average value for 5 minutes is generated after initialization.
-
Time spent initializing (in seconds): Indicates the time taken to initialize the Pod.
Time when the CpuByLimit value lower than the average value has been collected among the data for 5 minutes at the start of initialization - first data collection time
-
Average CpuByLimit during initialization: Indicates the average value of CpuByLimit during initialization.
-
Maximum memory during initialization: Indicates the maximum amount of memory used by the container during initialization.
CpuByLimit (cpu_per_quota) indicates the total CPU utilization based on the CPU limit.
Initialization complete
Initialization complete indicates the time point when data with a CpuByLimit value lower than the average value for 5 minutes is generated after initialization.
-
Initialization complete: Indicates the time when initialization is completed.
-
Average CpuByLimit after initialization: Indicates the average value of CpuByLimit after initialization.
-
Maximum memory after initialization: Indicates the maximum amount of memory used by the container after initialization.
-
After initialization is complete (seconds) (up to 5 minutes): Indicates the time in milliseconds for 5 minutes after initialization.