Performance Summary
Home > Select Project > Dashboard > Performance Summary
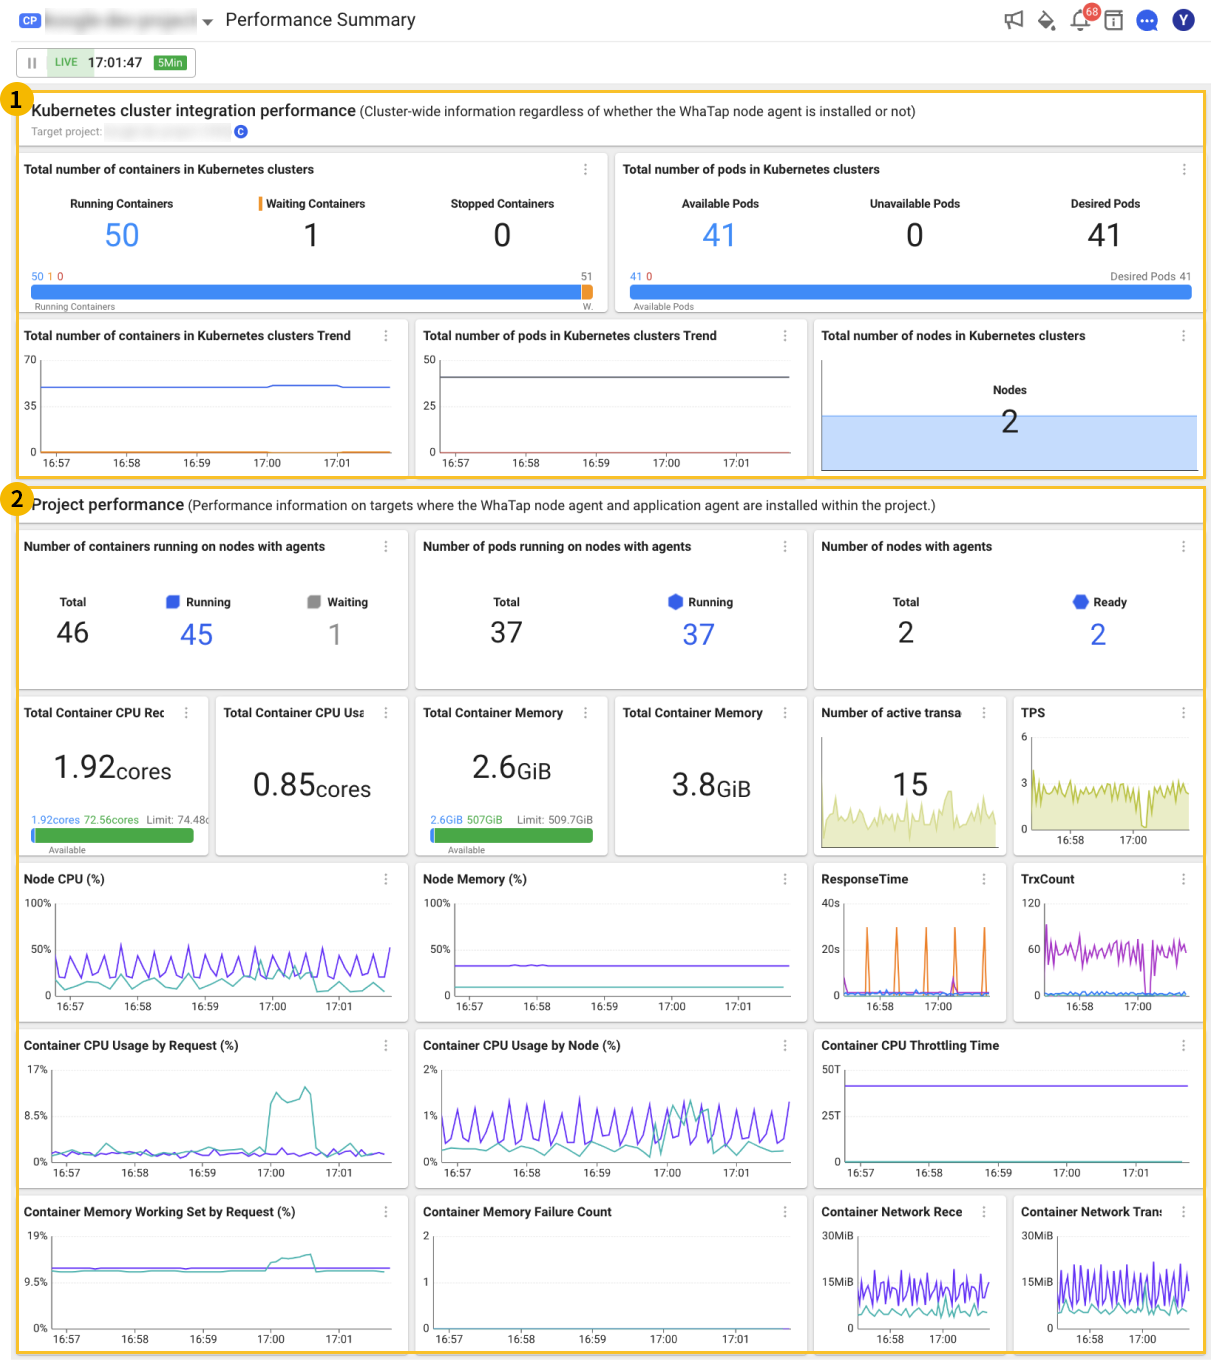
The charts for each late time zone display information of the target where the WhaTap node agent and application agent within the project. Information separated by the namespace project can be found in the namespace project.
-
Shortcut option
By selecting
 More icon at the upper right of each widget, you can see the
  Shortcut option as follows:
 -
Line chart configuration option
You can select the
More icon at the upper right of each line chart widget, or can directly check the  configuration options. For line charts, you can change the ID through the configuration option. The setting is not saved.
For the Node CPU (%) widget, you can view the data by Node for example. You can change the metric to view by ContainerName.
If the agent installation is not completed, data may not appear.
Node info
The widgets for node data are as follows:
-
Recent 30 minutes chart
- Node CPU (%), Node Memory (%), etc.
-
On the upper right of the node count widget, if you select
More > Shortcut, Cluster > Node List appears. -
If you select
More > Shortcut on the upper right of the Node CPU (%) widget or Node Memory (%) widget, Analysis > Metrics Chart appears. Using this menu, you can see the chart with detailed conditions.
Container Info
The widgets for container data are as follows:
-
Recent 10 minutes chart
- Container Status, Container CPU (%), Container Memory (%), etc.
Application information
The widgets for application data are as follows:
-
Recent 10 minutes chart
- Active TX, TPS, Response Time, etc.
The application data is displayed when the target application agent to be installed exists.