Node Map
Home > Select Project > Dashboard > Node Map
Requirements
-
The WhaTap Kubernetes agent 1.4.1 or later is required.
-
If it is a Kubernetes cluster project (
CP), you can view the corresponding menu.
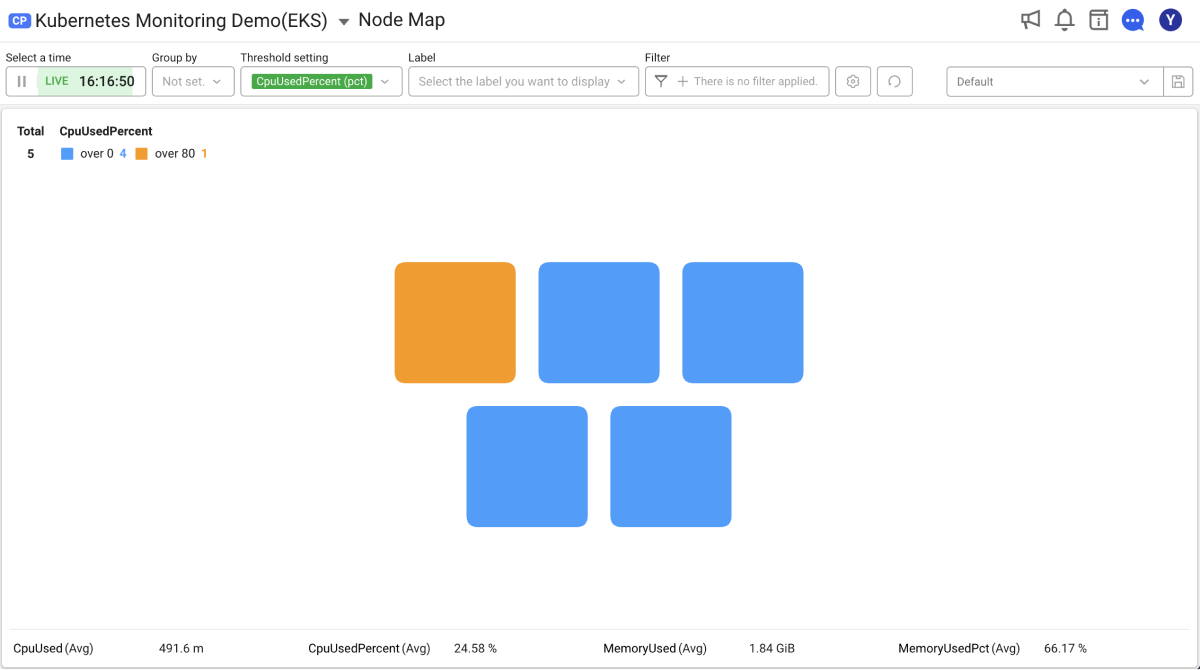
The Node Map menu provides the feature to monitor the status of nodes from a cluster perspective. It visualizes the node status, resource usage, and agent status to help users understand intuitively. Additionally, it supports a feature that allows you to easily check the previous status by viewing the node status at a previous time.
Basic screen guide
The Node Map menu largely consists of the User Configuration area and the Node Map Chart area.
For more information on how to use the time selector, see the following.
User Configuration
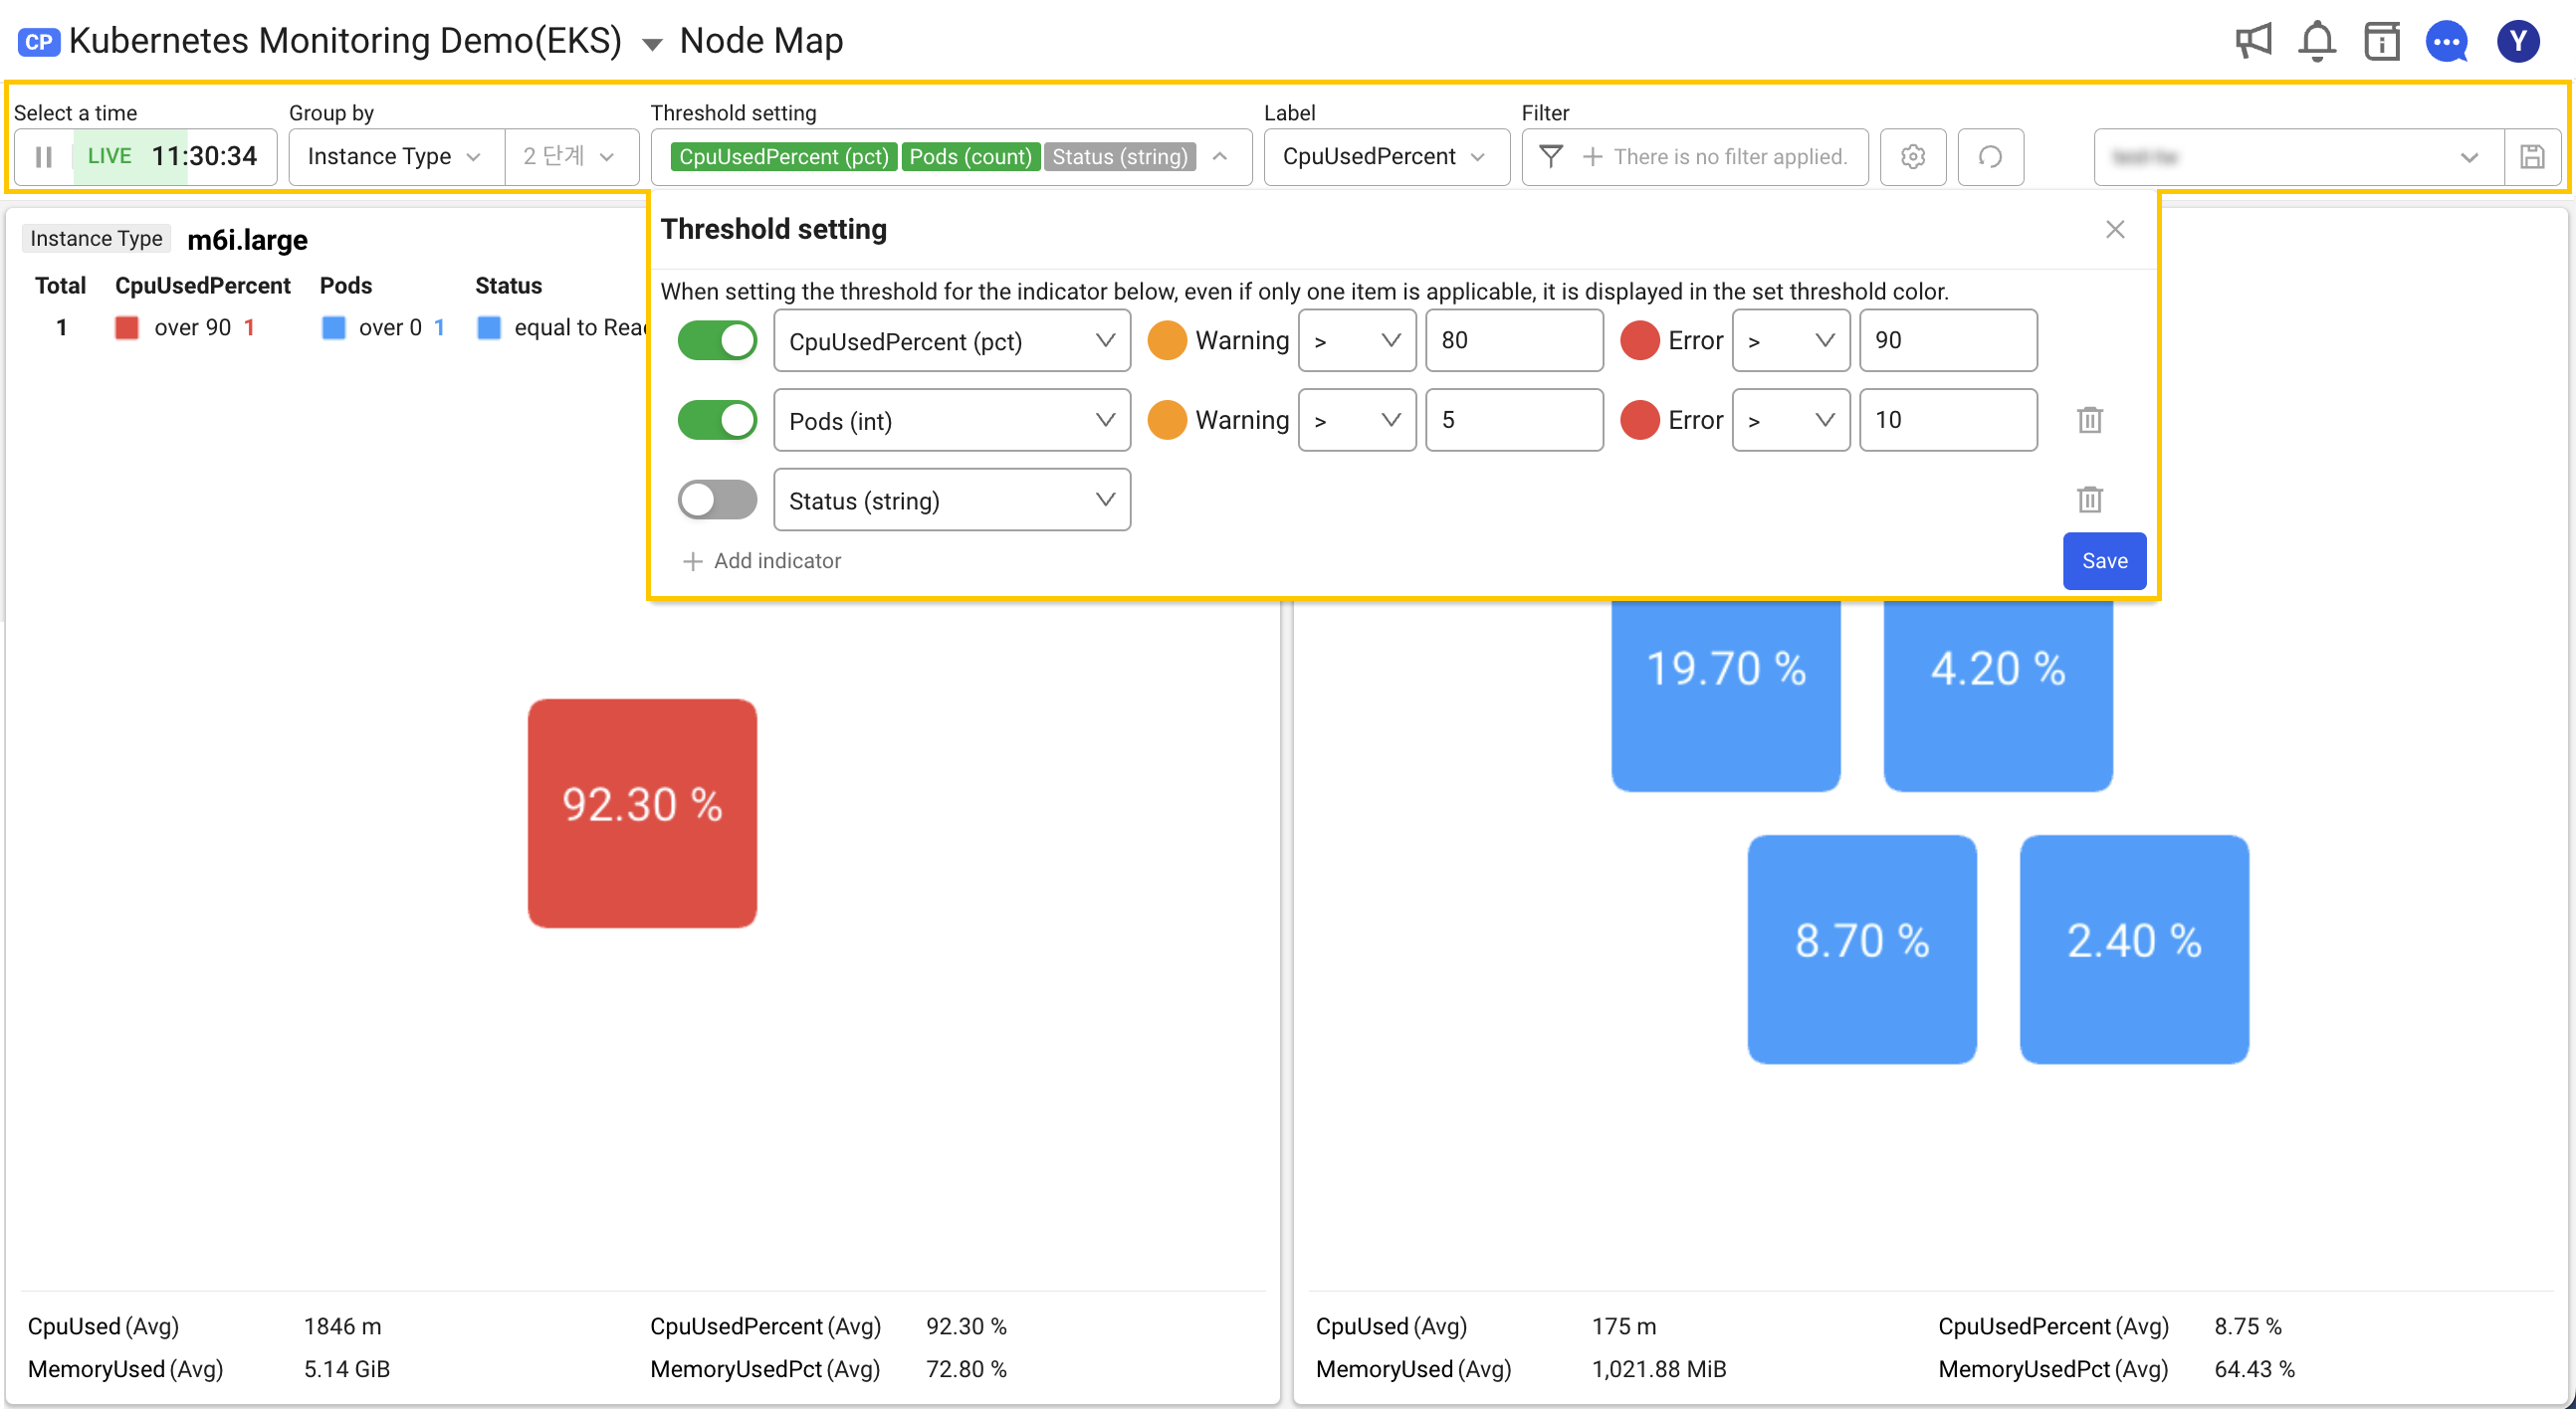
In the User Configuration area at the top of Node Map, you can configure additional settings for Group by, Threshold settings, Label, Filter, presets, and . The following example image has Group by, Threshold settings, and Label applied.
Grouping
Users can display nodes by Group by based on various conditions. This makes it easy to see the relationships between nodes within each group. The Group by feature supports up to 2 levels. Node Map Group by allows users to select nodes based on specific criteria to create a customized monitoring environment.
Setting the threshold
Users can represent the node status with colors via Threshold settings. You can set one or more metrics, and you can specify warning (Warning) and error (Error) sections for each metric. The normal (Normal) section is displayed in blue. Depending on the set range, an appropriate color to the status is applied.
-
Click the Threshold settings option.
-
Select a desired metric and then set Warning and Error sections.
-
To add a metric, click + Add Indicator at the bottom.
-
Once you have finished setting the thresholds for each desired metric, click Save at the bottom.
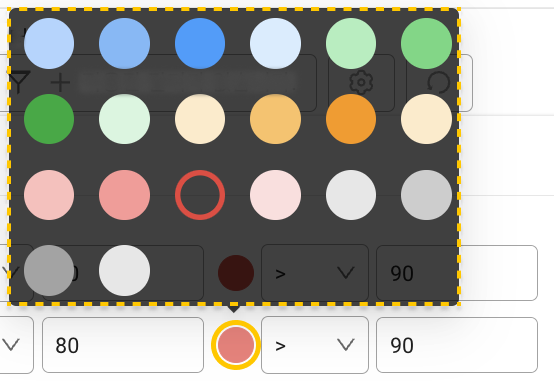
The abnormal sections such as Warning and Error are set to orange and red by default. You can customize the colors for each state in Threshold settings.
String type metrics
If a string type (String) metric has a specific string, it is designated as Error. For example, if the Status (string) metric contains a text, NotReady, the node is marked as Error and displayed in red.
| Metric name | Value | Error status |
|---|---|---|
| Status | Ready * / NotReady * | NotReady * |
| Ready | true / false | false |
| PIDPressure | true / false | true |
| DiskPressure | true / false | true |
| MemoryPressure | true / false | true |
| Unschedulable | true / false | true |
Node status display priority
Its highest priority is the Error section. If any of the metrics falls into the Error section, the node appears in red at first. In the following example, both and
nodes are marked as Error.
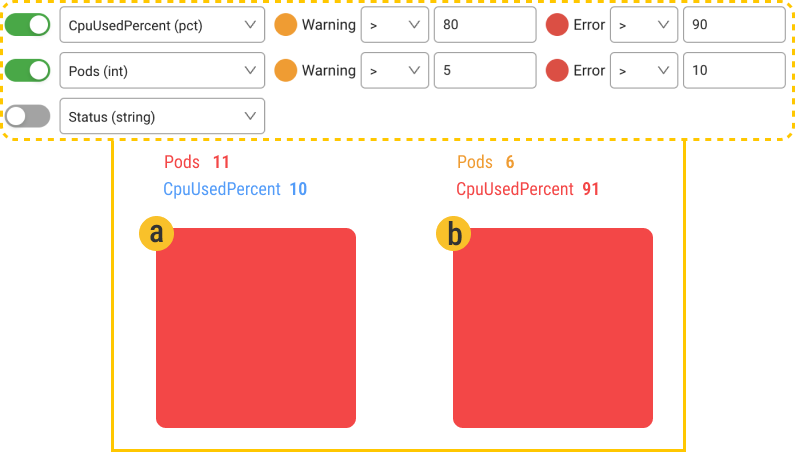
Label
Users can set text labels inside a node block to view the set key data at a glance. If you set Label based on the CpuUsedPercent metric, you can see the information inside the node block as in the example image on the left.
Filtering
Users can use filters by selecting nodes that meet specific conditions for intensive monitoring.
Preset
Users can save the set options as a preset and load them if needed. Presets are saved for each project. This allows project members to monitor the cluster with the same settings. A default preset (Default) is provided, and the default preset cannot be deleted.
Default preset
The default preset for Node Map is set to the threshold for the CpuUsedPercent (pct) metric as follows:
-
Normal: The value is
80or less. -
Warning: The value is greater than
80and90or less. -
Error: The value is greater than
90.
Additional function
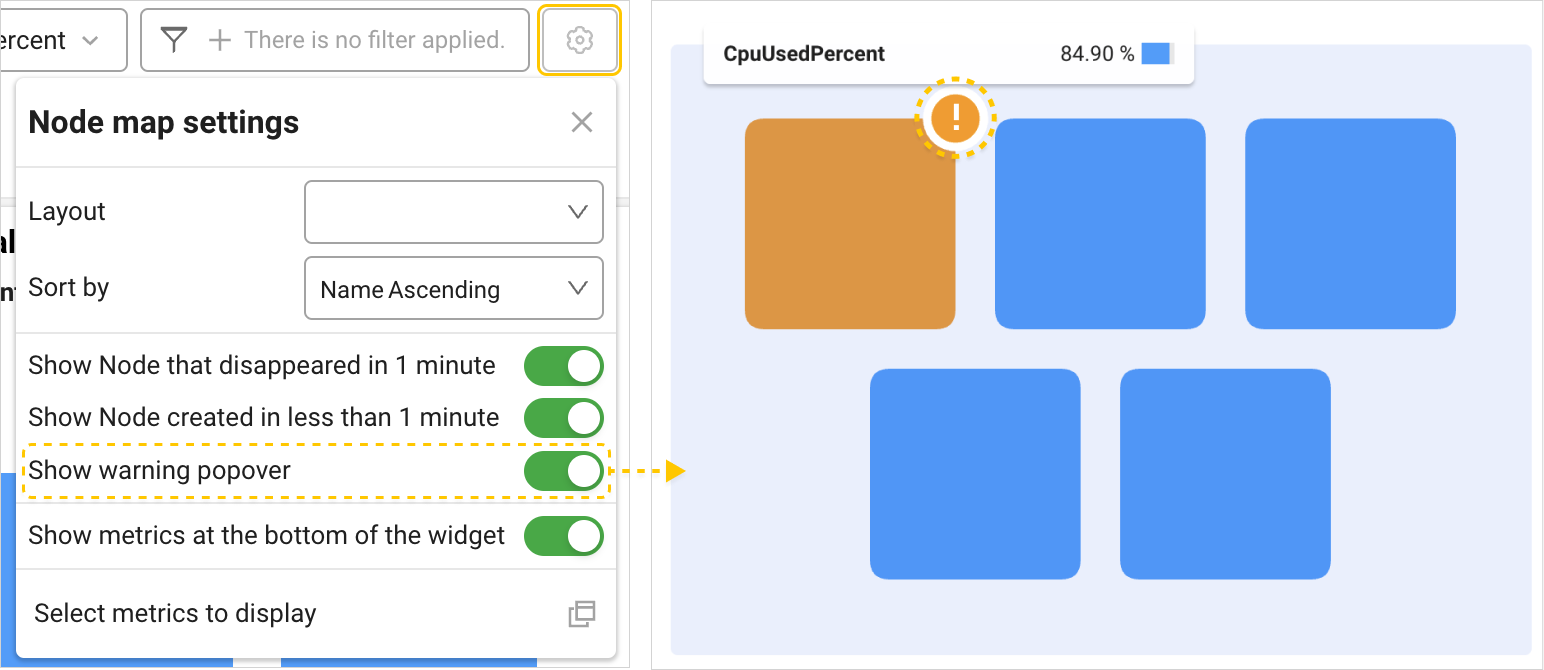
Through the on the upper right of Node Map, you can adjust additional detailed settings as follows:
-
Layout: It fixes columns of the grouped widgets.
-
Sort by: It sorts the widgets grouped by node count or name.
-
Show Node that disappeared in 1 minute: It displays the nodes that have disappeared within the last minute.
-
Show Node created in less than 1 minute: It displays the nodes created within the last minute.
-
Show Warning Popover: It displays a warning popover when a specific node is in a Warning or Error status depending on Threshold settings.
-
Show Metrics at the Bottom: Set whether to display the average, sum, maximum, and minimum values at the bottom of the widget.
-
Metrics to Display: Select a metric to display at the bottom of the widget. Select a metric and set it to display data for the metric as an average, sum, maximum, or minimum for all grouped nodes.
Node map chart
The Node Map chart consists of the following three areas:

Top area of the widget
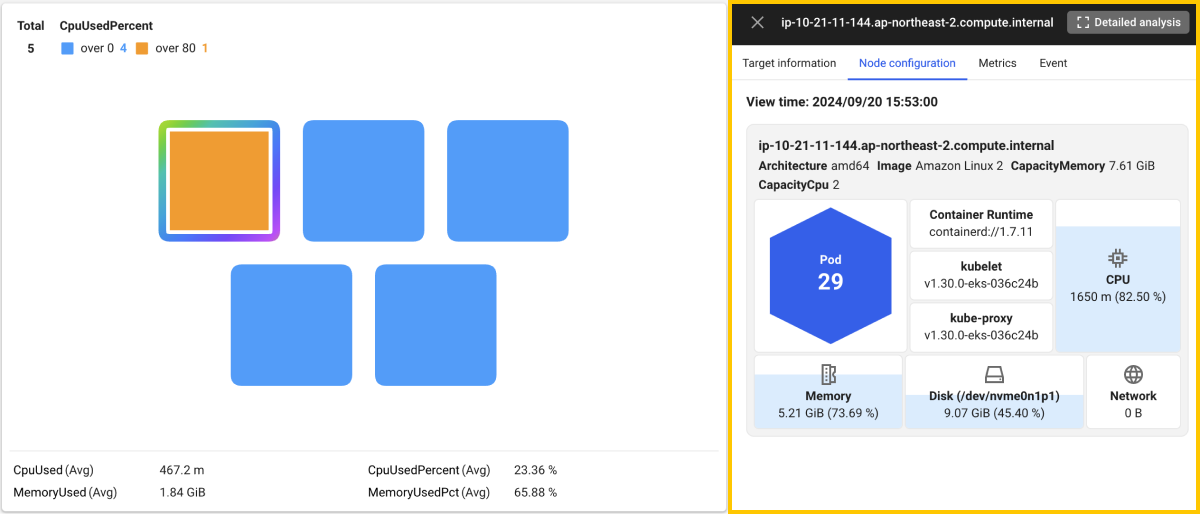
It displays the total number of nodes, or the total number of grouped items, and the numbers of states for the selected metric.
Visualization area in the center
It provides a visual dashboard that allows you to intuitively check the overall node status and count.
Bottom area of the widget
It displays the statistics for a selected metric. It displays the data in a desired manner among sum, maximum, and minimum values as set through Metrics to Display in Additional Settings.
Node Map only displays the nodes that have node agents installed.
Summary view and detailed analysis
In Node Map, select a node to view. You can check the summary data of the object through the summary view screen that appears on the right. You can check the detailed analysis screen by clicking Detailed analysis on the summary view screen.
Target information
In the Target information tab, you can check the key properties of a selected node. You can also move to the Node list and Container map menus.
Node summary analysis
You can check the summary information of node resource allocation and usage status through Node summary analysis.
-
Basic information: It provides the cluster version of the node, startup time, current status, whether it is schedulable, internal IP address, region, and zone.
-
Operating system and hardware information: It provides the operating system on which the node is running, OS image, CPU architecture, number of cores, and total memory size. You can check the allocatability and current usage of the memory and CPU of a node.
-
Resource usage status: It displays the remaining resources through the difference between requests and allocatable resources (CPU, memory) for all containers running on the node. It summarizes the resource usage status, including the actual CPU and memory utilization.
-
Disk usage status: It provides information about the disks attached to the node, file system types, device IDs, mount points, total and used capacity, and utilization.
-
Pod status and resource availability: By comparing the total number of allocatable Pods on the node to the number of running Pods, you can see how many additional Pods can be run. In addition, the stability of the node is checked through the status of MemoryPressure, DiskPressure, PidPressure, and such.
The Labels metric is supported in Kubernetes agent 1.7.9 or later.
Node configuration
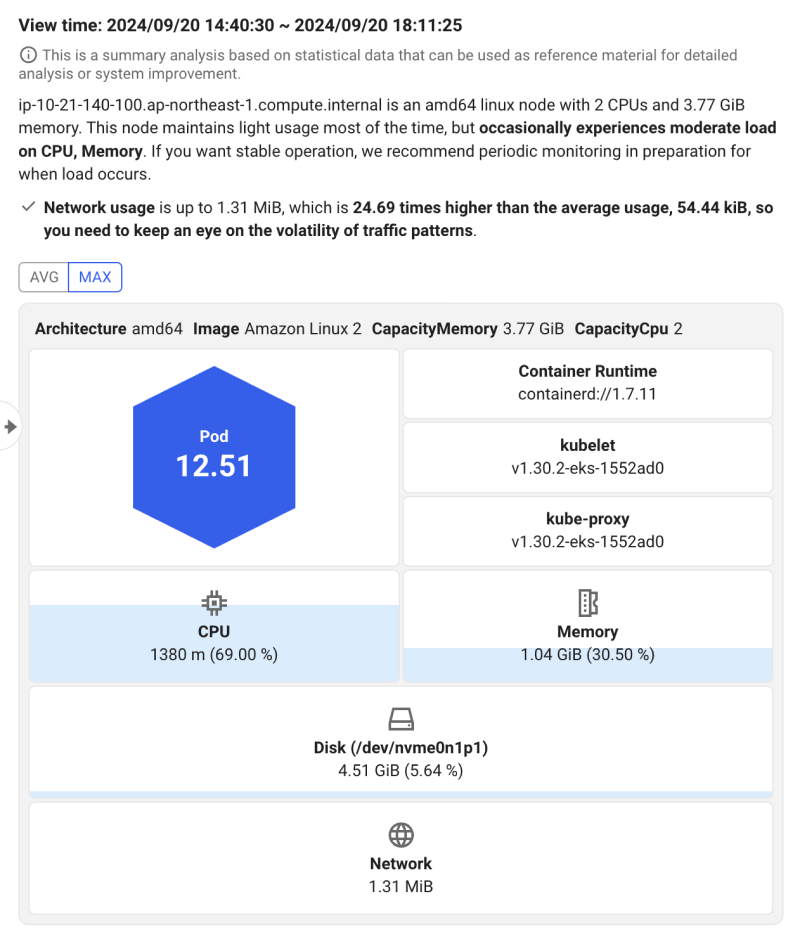
It provides a summary of the node configuration and overall resource usage selected in theNode configuration tab. You can comprehensively see the hardware and software components of the node. Users can monitor resource usage of nodes and the status of each component, as well as performance and operational stability.
-
Node system specifications
-
Architecture: Hardware architecture used by the node.
-
Image: Information about the operating system image that the node is running on.
-
CapacityMemory: Total memory capacity of the node.
-
CapacityCpu: Total CPU capacity of the node.
-
-
Software configuration
-
Container Runtime: Version of the container runtime used on the node.
-
kubelet: Version of the Kubernetes kubelet running on the node.
-
kube-proxy: Version of the kube-proxy that manages the network features.
-
-
Resource usage status
-
CPU: CPU usage of the node.
-
Memory: Memory usage of the node.
-
Disk: Disk capacity and usage rate on the node.
-
Network: Network throughput
-
-
If you click CPU, memory, disk, or network, the Metrics tab appears that can display the usage trend for the query period.
-
By clicking AVG and MAX, you can see the average usage and maximum usage for the query period.
Process
The Process tab provides information about the major Kubernetes management processes inside the selected node. It can prevent cluster failures caused by process issues and minimize the downtime.

Process details
-
You can check information details about a process by selecting the
icon in the Detail column on the left of the process list.
-
You can select a method how to aggregate the statistical data during retrieval while querying long-term data of 3 days or more by clicking AVG or MAX.
-
When you click a process key data value, the value is copied.
The Process tab is supported in Kubernetes agent 1.7.14 or later.
Metrics
You can check the resource usage trend of the node select in the Metrics tab. You can check the usage changes in CPU, memory, network, and disk based on the average (AVG) and maximum (MAX) values during the query period.
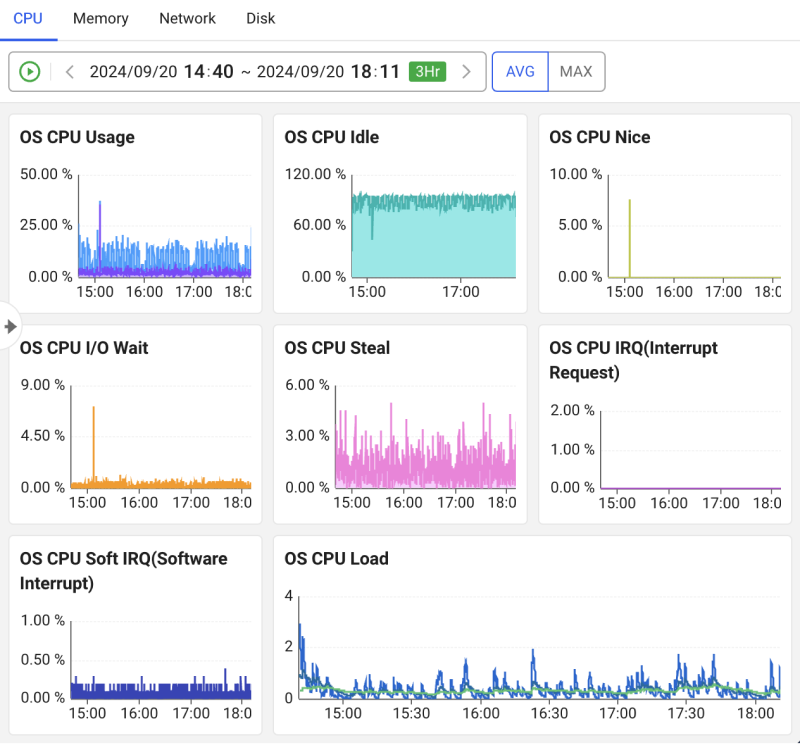
-
AVG: Average usage for the query period.
-
MAX: Maximum usage for the query period.
-
Total: Total traffic usage across multiple network interfaces.
-
In/Out: Inbound (receiving) and outbound (sending) traffic usage for a specific network interface.
The K8s CPU Request / Allocatable CPU (%) widget is supported in Kubernetes agent 1.7.10 or later.
Event
You can check K8s Node events and WhaTap Node events that occurred on the node selected in the Event tab. K8s node events include important activity logs within the cluster such as changes in node status, while WhaTap node events provide information about the events triggered based on the user-defined alert criteria.
