Node Disk List
Home > Select Project > Cluster > Node Disk List
Requirements
-
The WhaTap Kubernetes agent 1.7.8 or later is required.
-
If it is a Kubernetes cluster project (
CP), you can view the corresponding menu.
It views Node Disk List. You can easily check the status of disks by monitoring the current usage, free space, and performance meetrics of individual disks mounted on each node in real time in Node Disk List for WhaTap Kubernetes Monitoring. This allows you to efficiently manage disk resources in the cluster and proactively find and respond to potential problems.
Basic screen guide
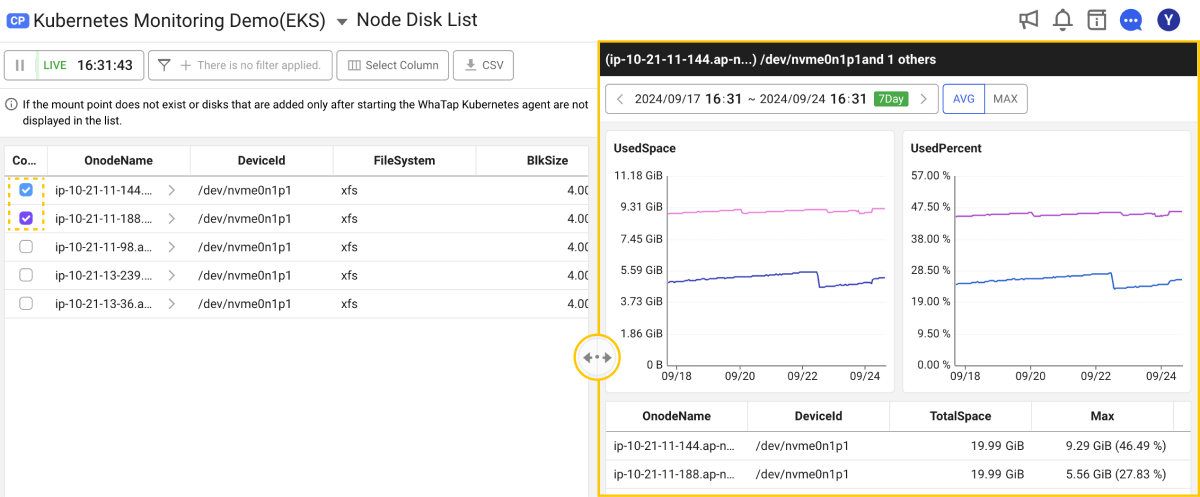
You can check the list of nodes existing in the cluster and the list of disks mounted on the node as follows. The list is displayed based on the disk information collected over the last minute based on the query time.

Hidden node disk
When the WhaTap Kubernetes agent runs, the lists of disks mounted on each node appear. The disk does appear in the list in the following cases:
-
The disk must have been mounted to a specific path to display in the list. The disks that do not have any mount point do not appear in the list.
-
The disks added after the WhaTap Kubernetes agent runs do not appear in the list.
Filtering
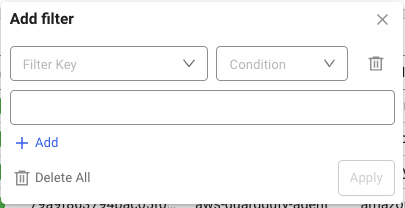
By using the Filtter option, you can select a desired for view. Through the and condition, multiple filters can be applied.
-
If you select
Add icon in the
Filter field, the Add filter window appears as follows:

-
Select Filter Key and Condition.
-
Select a value that meets the conditions.
-
-
Configure a filter and then select Apply to apply the filter.
-
To add multiple filters, select
Add icon in the Filter field or Add filter window.
Select Column
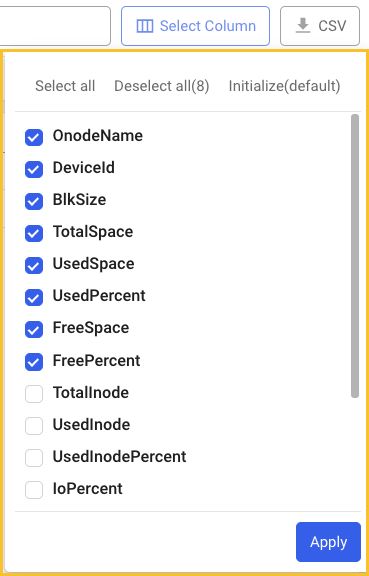
When using the Select column option, you can select the desired data to view the list.

-
The selected column list is kept even if you re-enter the menu.
-
If you select Reset, the predefined default key metric columns are selected. In this case, the column selection history is deleted.
-
After selecting a column, you can click Apply at the lower right to apply the selected values.
Comparing
Through the Comparison option, you can compare the disk usage. If you check in the Comparison column of the node disk to view in the list, a window comparing the details of the disks appears on the right.

For example, you can see the hourly usage and utilization for each disk through the UsedSpace and UsedPercent graphs. Using this, you can intuitively see the changes in disk usage over a specific time zone. You can also check detailed data such as maximum and minimum usage and increase/decrease rate for each disk through the detailed data list at the bottom. The columns are as follows:
-
OnodeName: It displays the name of the node to which the disk is connected.
-
DeviceId: It indicates the device ID of the disk, which can be used to distinguish a specific device on the disk.
-
Max: It displays the maximum usage and peak utilization of the disk recorded during the query period.
-
Min: It displays the minimum disk usage and minimum utilization recorded during the query period.
-
First / Last: You can see the change in usage through the first and last data collected during the query period.
-
Increase: It displays the increase/decrease rate of disk usage during the selected period.
-
Increase(Per Day): This value is calculated for increase/decrease rate of the average daily usage during the query period, allowing you to check the disk usage change trend. This value is not displayed if the query period is less than one day.
-
PredictedSpace(N days later): This value predicts the expected usage after N days based on the average daily increase/decrease rate. This value is not displayed if the query period is less than one day.
For example, if the query period is 7 days, it displays the expected usage after 7 days.
-
By clicking AVG and MAX, you can see the average usage and maximum usage for the query period.
-
By dragging
to the left or right, you can adjust the screen size.