Node Details
Home > Project Select > Node > Node details
The Node details screen consists of four charts at the top and container and Pod details in the node. The node selector allows you to select a node to search.
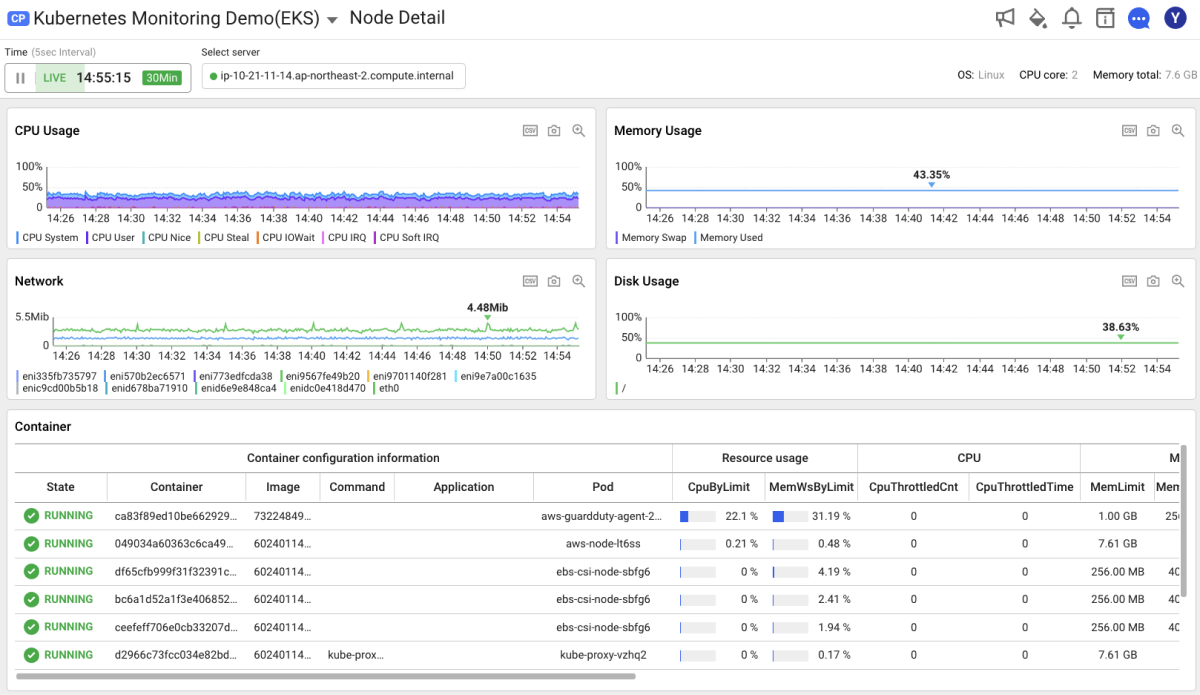
The last 1-minute data is updated every 5 seconds.
Top charts
You can check information for the following four charts:
-
CPU Usage: You can see the CPU usage of the node.
-
Memory Usage: You can see the memory usage of the node.
-
Network: You can see the input/output traffic and error packets of the node's network interface.
-
Disk Usage: You can see the disk usage of the node.
Container and Pod details
Container
When you select the Container tab, at the top of the container details within the node, you can see the sum of the following metrics: cpu_quota, cpu_request, cpu_total_milli, mem_limit, mem_request, and mem_working_set.
-
If you select a desired column, you can search the container list sorted by that column.
-
When the Overview column is selected, you can see Container summary analysis.
-
If you select a container, the Container list menu appears. For more information, see the following.
Pod
When you select the Pod tab, the detailed Pod information is viewed. At the top of the container details, you can see the sum of the following metrics: cpu_quota, cpu_request, cpu_total_milli, mem_limit, mem_request, and mem_working_set.
-
If you select a desired column, you can search the Pod list sorted by that column.
-
When the Overview column is selected, you can see Pod summary analysis.
-
If you select a Pod, the Pod list menu appears. For more information, see the following.