kube-apiserver Metrics Search
Home > Select Cluster Project > Cluster > kube-apiserver Metrics Search
Requirements
-
The WhaTap Kubernetes agent 1.5.6 or later is required.
-
If it is a Kubernetes cluster project (
CP), you can view the corresponding menu.
The kube-apiserver is a component that handles the requests inside and outside the Control Plane. You can see the original data consistency of the metrics collected from kube-apiserver through the View kube-apiserver metrics menu.
Basic screen guide
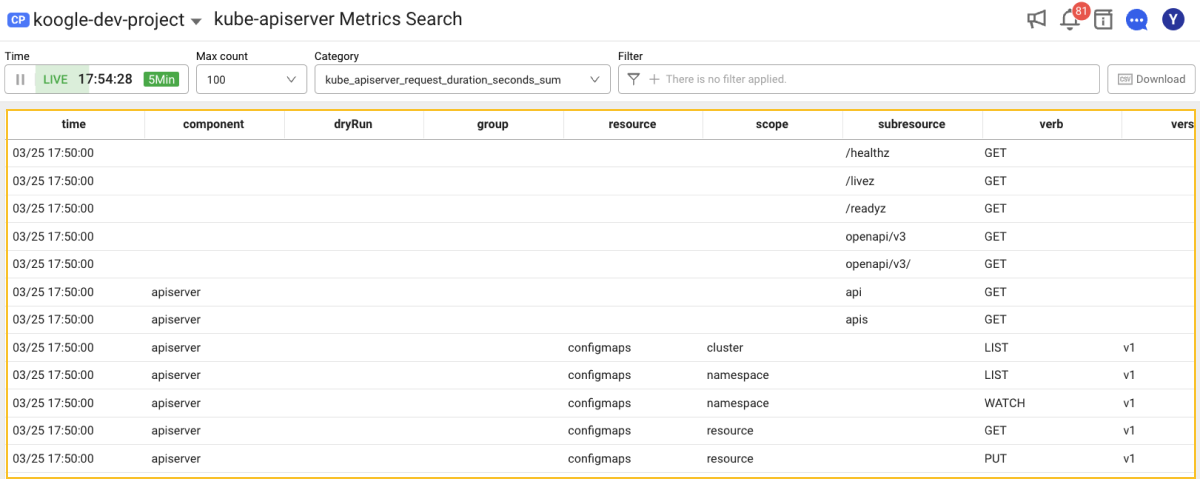
The View kube-apiserver metrics menu provides the feature to query the original monitoring data collected from kube-apiserver for each Category. Data collected for the last 5 minutes is reflected at an interval of 1 minute.
-
You can view the data from a specific point in the past by using the Time selector on the upper left. To view the past data, select desired options and then click the
 Search icon.
 -
You can set Max count for view.
-
You can filter metrics to process the original data as needed.
-
Select the Download icon at the upper right corner and then download desired data as a CSV format file.
Filtering
By using the Filtter option, you can select a desired for view. Through the and condition, multiple filters can be applied.
-
If you select
 Add icon in the
  Filter field, the Add filter window appears as follows:
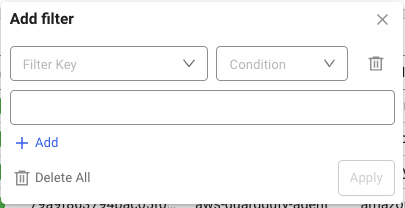
-
Select Filter Key and Condition.
-
Select a value that meets the conditions.
-
-
Configure a filter and then select Apply to apply the filter.
-
To add multiple filters, select
Add icon in the Filter field or Add filter window.
Enabling the kube-apiserver monitoring
When installing the WhaTap Kubernetes agent, modify the yaml file downloaded according to the following instructions to enable the kube-apiserver monitoring.
-
Add the agent container specifications for kube-apiserver monitoring under the spec of the
whatap-master-agentdeployment.containers:
- name: whatap-control-plane-helper
image: whatap/kube_mon
imagePullPolicy: Always
ports:
- containerPort: 9496
command: ["/data/agent/master/whatap_control_plane_helper"]
args: ["-collect_control_plane_monitoring_enabled=true"]See the following example:
apiVersion: apps/v1
kind: Deployment
metadata:
name: whatap-master-agent
namespace: whatap-monitoring
spec:
replicas: 1
selector:
matchLabels:
name: whatap-master-agent
template:
metadata:
labels:
name: whatap-master-agent
spec:
containers:
  - name: whatap-control-plane-helper
    image: whatap/kube_mon
    imagePullPolicy: Always
    ports:
      - containerPort: 9496
    command: ["/data/agent/master/whatap_control_plane_helper"]
    args: ["-collect_control_plane_monitoring_enabled=true"]
- name: whatap-master-agent
image: whatap/kube_mon
imagePullPolicy: Always
resources:
requests:
memory: 300Mi
cpu: 100m
limits:
memory: 350Mi
cpu: 200m
ports:
- containerPort: 6600
command: ['/bin/entrypoint.sh']
env:
- name: WHATAP_LICENSE
value: "xxxxxxxx-12345xxxxxx-x00e000000xxx8"
- name: WHATAP_HOST
value: "13.124.11.223/13.209.172.35"
- name: WHATAP_PORT
value: "6600"
- name: WHATP_MEM_LIMIT
valueFrom:
resourceFieldRef:
containerName: whatap-master-agent
resource: limits.memory
volumeMounts:
- name: start-script-volume
mountPath: /bin/entrypoint.sh
readOnly: true
subPath: entrypoint.sh
- mountPath: /whatap_conf
name: whatap-config-volume
volumes:
- name: start-script-volume
configMap:
defaultMode: 0700
name: master-start-script
- name: whatap-config-volume
emptyDir: {}
serviceAccount: whatap -
Add the following to the env settings in the
whatap-master-agentcontainer specifications of thewhatap-master-agentdeployment.env:
- name: collect_control_plane_monitoring_enabled
value: "true"See the following example:
apiVersion: apps/v1
kind: Deployment
metadata:
name: whatap-master-agent
namespace: whatap-monitoring
spec:
replicas: 1
selector:
matchLabels:
name: whatap-master-agent
template:
metadata:
labels:
name: whatap-master-agent
spec:
containers:
- name: whatap-control-plane-helper
image: whatap/kube_mon
imagePullPolicy: Always
ports:
- containerPort: 9496
command: ["/data/agent/master/whatap_control_plane_helper"]
args: ["-collect_control_plane_monitoring_enabled=true"]
- name: whatap-master-agent
image: whatap/kube_mon
imagePullPolicy: Always
resources:
requests:
memory: 300Mi
cpu: 100m
limits:
memory: 350Mi
cpu: 200m
ports:
- containerPort: 6600
command: ['/bin/entrypoint.sh']
env:
  - name: collect_control_plane_monitoring_enabled
    value: "true"
- name: WHATAP_LICENSE
value: "xxxxxxxx-12345xxxxxx-x00e000000xxx8"
- name: WHATAP_HOST
value: "13.124.11.223/13.209.172.35"
- name: WHATAP_PORT
value: "6600"
- name: WHATP_MEM_LIMIT
valueFrom:
resourceFieldRef:
containerName: whatap-master-agent
resource: limits.memory
volumeMounts:
- name: start-script-volume
mountPath: /bin/entrypoint.sh
readOnly: true
subPath: entrypoint.sh
- mountPath: /whatap_conf
name: whatap-config-volume
volumes:
- name: start-script-volume
configMap:
defaultMode: 0700
name: master-start-script
- name: whatap-config-volume
emptyDir: {}
serviceAccount: whatap -
Add the following roles to the
whatapClusterRole to collect the control plane monitoring performance metrics.rules:
- nonResourceURLs: ["/metrics"]
verbs: ["*"]See the following example:
apiVersion: rbac.authorization.k8s.io/v1
kind: ClusterRole
metadata:
  annotations:
    rbac.authorization.kubernetes.io/autoupdate: "true"
  name: whatap
  namespace: whatap-monitoring
rules:
  - apiGroups: ["*"]
    resources: ["namespaces", "pods", "pods/log", "configmaps","services", "endpoints","daemonsets","ingresses","deployments","nodes","persistentvolumes","persistentvolumeclaims", "events", "replicasets", "roles", "rolebindings", "clusterroles", "clusterrolebindings", "jobs", "cronjobs", "statefulsets", "serviceaccounts", "configmaps", "storageclasses", "horizontalpodautoscalers" ]
    verbs: ["get","list","watch"]
  - apiGroups: [""]
    resources: ["pods/exec"]
    verbs: ["create"]
  - apiGroups: [""]
    resources: ["configmaps"]
    verbs: ["*"]
  - nonResourceURLs: ["/metrics"]
    verbs: ["*"]
---
You can also enable the kube-apiserver monitoring via the kubectl apply or kubectl edit command.
kube-apiserver metrics
| Classification | Metric | Description |
|---|---|---|
| API GET request | GET requests per minute | Number of GET requests per minute of kube-apiserver |
| Trend of GET request counts per second | Trend of GET request counts per second of kube-apiserver | |
| Trend of GET request counts per minute for each resource and subresource | Trend of the GET request counts per minute by resource and subresource incoming to kube-apiserver | |
| API POST request | POST requests per minute | Number of POST requests per minute of kube-apiserver |
| Trend of POST request counts per second | Trend of POST request counts per second of kube-apiserver | |
| Trend of POST request counts per minute for each resource and subresource | Trend of the POST request counts per minute by resource and subresource incoming to kube-apiserver | |
| Requests by API response code | [ 2xx ] Request count per minute | The number of requests per minute with the response codes between 200 and 300 among kube-apiserver requests. |
| [ 2xx ] Trend of request counts per minute for each response code | Response code-based request counts per minute with the response codes between 200 and 300 among kube-apiserver requests. | |
| [ 2xx ] Trend of request counts per minute for each resource and subresource | Trend of request counts per minute grouped by resource and subresource with the response codes between 200 and 300 among kube-apiserver requests. | |
| [ 3xx ] Request count per minute | The number of requests per minute with the response codes between 300 and 400 among kube-apiserver requests. | |
| [ 3xx ] Trend of request counts per minute for each response code | Response code-based request counts per minute with the response codes between 300 and 400 among kube-apiserver requests. | |
| [ 3xx ] Trend of request counts per minute for each resource and subresource | Trend of request counts per minute grouped by resource and subresource with the response codes between 300 and 400 among kube-apiserver requests. | |
| [ 400~ ] Request count per minute | The number of requests per minute with the response codes above 400 among kube-apiserver requests. | |
| [ 400~ ] Trend of request counts per minute for each response code | Response code-based request counts per minute with the response codes below 400 among kube-apiserver requests. | |
| [ 400~ ] Trend of request counts per minute for each resource and subresource | Trend of request counts per minute grouped by resource and subresource with the response codes above 400 among kube-apiserver requests. | |
| Go Metrics | Number of goroutines | Number of current goroutines |
| Number of threads | Current OS thread count | |
| Number of active requests (1 second) | Number of requests run in the last 1 second | Number of requests run within 1 second in kube-apiserver during data collection |