Correlated project management
This document provides information about the Correlated Project Management menu. WhaTap provides integration visibility based on the data link between projects. You can search for linked projects through tags and quickly check key metrics that may cause problems in the project.
-
It provides controls such as viewing, adding, and deleting the linked projects.
-
The correlations between added projects can be analyzed.
Basic screen guide
Home > Select Project > Management > Correlated Project Management
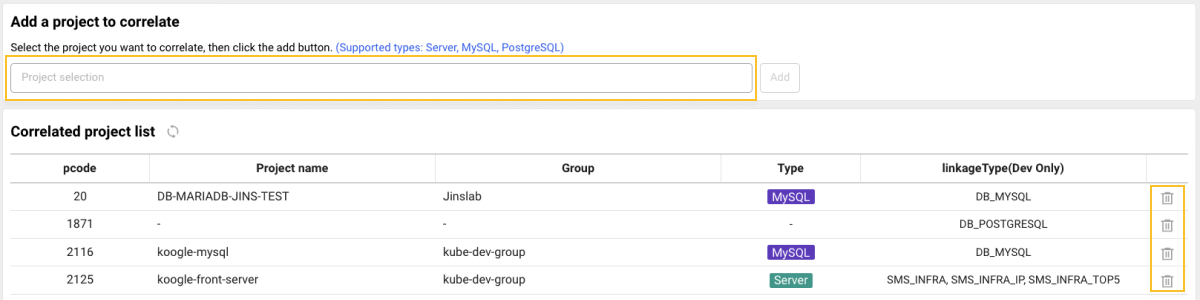
The following guides you to the basic screen layout of the Correlated Project Management menu. It consists of Add a project to correlate at the top and Correlated project list at the bottom.
Adding a correlated project
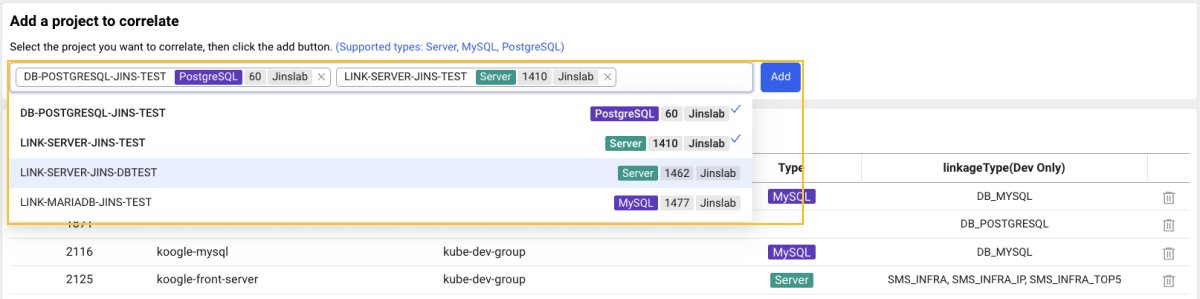
You can add any correlated project. By clicking the Project selection window, you can view the projects that can be linked as follows:
-
In the Project selection window, you can perform search by Project code and Project name.
-
If you select a project, the Add button is enabled. You can select multiple projects.
-
If you click Add with a project selected, you can see that the project has been added to Correlated project list at the bottom along with a guide message.
Deleting a correlated project
To exclude any added project from the correlations, click the ![]() Delete icon on the right of the Correlated project list.
Delete icon on the right of the Correlated project list.
-
Server, PostgreSQL, and MySQL products are supported now.
-
If the added correlated project does not appear in the list, wait a moment and then select the
 Refresh icon to refresh information.
 -
In case of Delete, the Edit project role is required.
Correlation analysis example
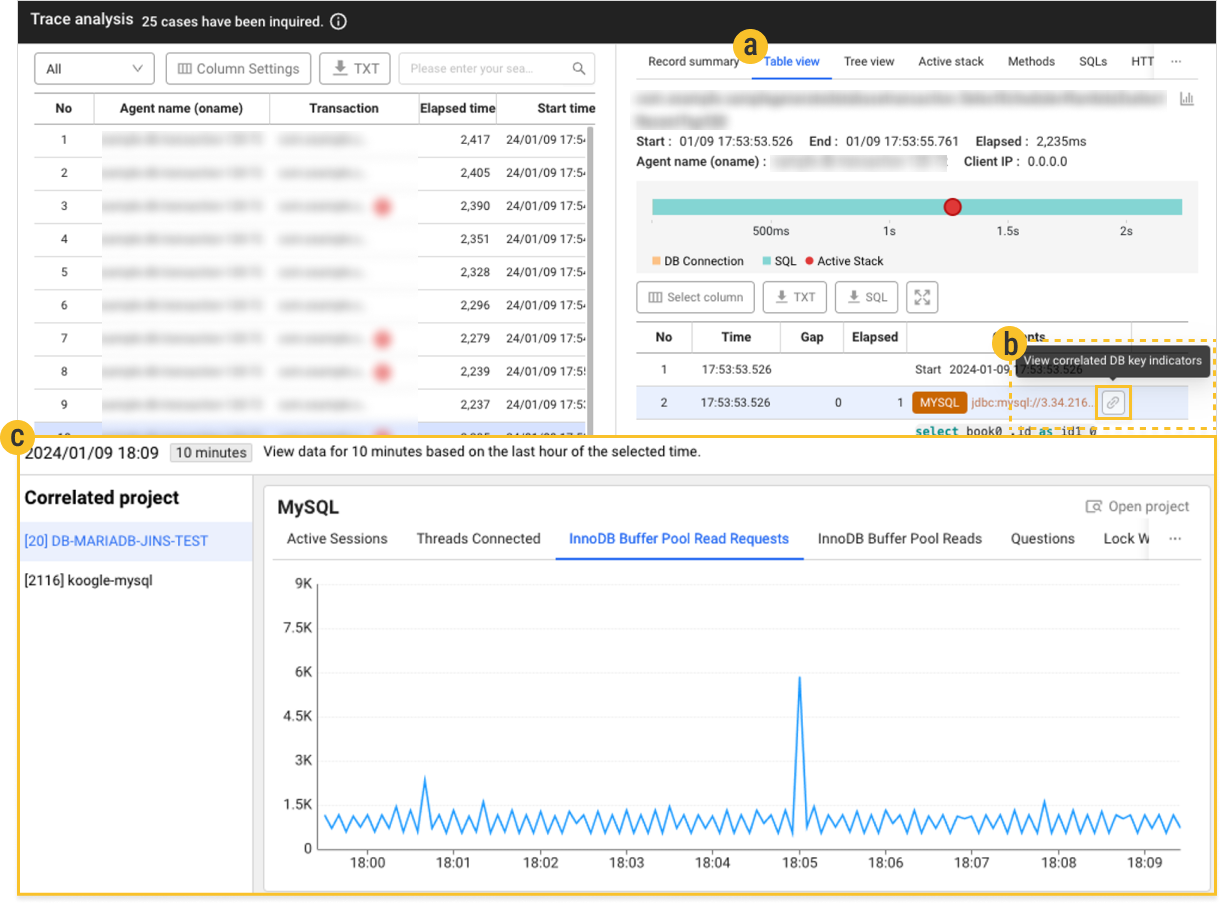
Drag Hitmap and go to the Trace analysis window > Select a transaction > Select Table view on the right of the detailed analysis screen
The following provides a correlation analysis example based on the correlated projects.
-
By dragging Hitmap on the Application service dashboard, go to the Trace analysis window.
-
Select a transaction to view, and then select
 Table view on the detailed analysis screen to the right.
 -
If you select
 Correlation icon in the
  area, you can see key metrics of the
  correlated projects. If there are multiple correlated scenarios, the drop-down provides a list of desired analysis scenarios.
Lookup time
It displays data for 10 minutes based on the last viewed time.
For example, if you drag data in the 34 to 36 minute range of Hitmap, the data from 26 to 36 minutes appear.