Trace
Select Home > Select Project > Dashboard > Container Map > Target, and then Detailed analysis > Trace.
Containerized Application Trace
During Kubernetes monitoring, it is difficult to pinpoint the current status or cause of a failure by simply monitoring the cluster without tracing the applications in the Kubernetes environment.
When tracing the cause of a failure, it is often an application-level problem such as delay in SQL processing of a specific transaction or business logic error.
WhaTap Kubernetes trace function provides information about status monitoring for applications running on containers.
To trace applications running on Kubernetes, the WhaTap monitoring agent must have been installed on each application container such as Java, Node.js, and Python. For more information about the agent installation, see the following.
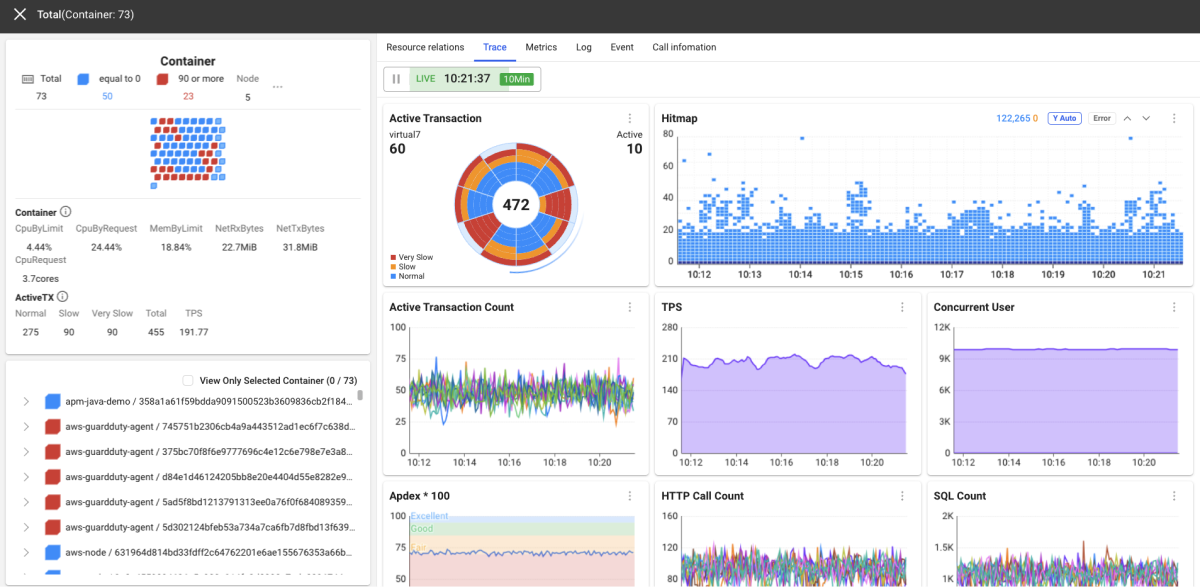
Dashboard
Dashboard provides key data for the following applications:
-
Active Transaction: Current running transactions that are distinguished by color.
- Red (Very slow): 8 seconds or more
- Orange (Slow): 3 to 8 seconds
- Blue (Normal): 0 to 3 seconds
-
Active Transaction Count(Active Transaction Trend)
-
Htimap: Distribution of response times for completed transactions
- Horizontal axis: Transaction end time
- Vertical axis: Execution time
- Transactions with longer execution times are at the top of the distribution.
- Transaction data can be checked when dragging a specific area.
-
TPS (Transaction Per Second): Number of transactions processed per second
-
Concurrent User: Concurrent users
-
Apdex * 100 (Application Performance Index): Measured user satisfaction for web applications
-
HTTP Call Count: Number of HTTP calls
-
HTTP Call Error Count: Number of HTTP call errors
-
SQL Count
-
SQL Error Count
-
Transaction Total Count: Number of all transactions
-
Transaction Error Count: Number of transaction errors
-
Response Time: Response time
-
Heap Memory Usage: Heap memory usage, available maximum/current memory
- Real-time monitoring for changes in memory usage over time
- Process total memory usage in case of Python
-
ThreadCount: Number of threads. Node.js and Python are excluded.
-
GC Count: Number of GCs. Node.js and Python are excluded.
-
GC Old Generation Count: Number of GCs in the Old area (Node.js and Python excluded)
Trace Analysis
You can check Trace analysis by dragging the desired section to view in Hitmap of the dashboard. After selecting a desired transaction from the transaction list, you can check the step information under each transaction at a glance.
For more information about the trace analysis, see the following.