Target Information
Select Home screem > Select Project > Dashboard > Container Map > go to Detailed analysis > check the target information list on the left.

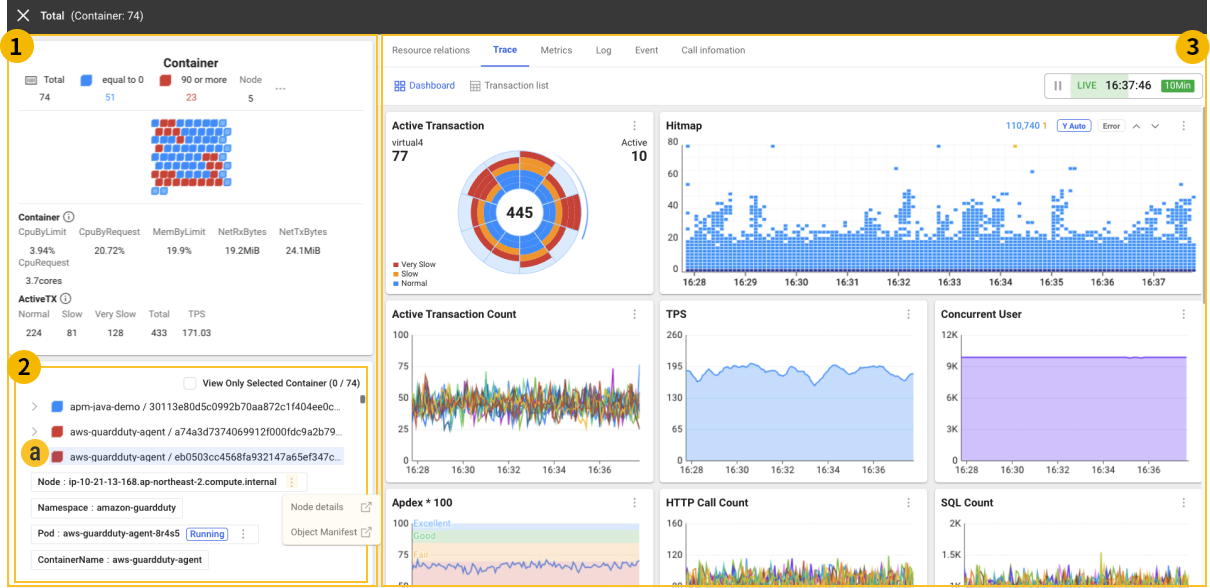
In the container view or pod view, a block represents each container or Pod. When you additionally select a target in the Summary information card, you can see the information of the selected target in
Target information list and
through the Detail tab.
If you select View Only Selected at the top of the Target information list, only the selected containers or Pods appear as follows:

After selecting a block, you can check detailed target information such as the node on which the selected container or pod is running, the affiliated namespace and object manifest through the Target information list within Detailed analysis or go to the list menu as shown under
.
-
Node: You can check Node details, Object manifest, Node summary analysis and move to the Node list menu.
-
Deployment: You can check the Object manifest and go to the Deployment list menu.
-
ReplicaSet: You can check the Object manifest.
-
Pod: You can check the Object manifest and Pod summary analysis and go to the Pod list menu.
-
ContainerId: You can check the Container info and Container summary analysis and go to the Container list menu.
-
Image: You can check the container image and go to the Container image menu.
-
ServiceName: You can check the Object manifest and go to the Service list menu.
Kubernetes status summary analysis
It provides a summary analysis report on the performance and resources for each container, Pod, and node in the Kubernetes environment. You can monitor the resource allocation and usage for containers, Pods, and nodes in the clusters and namespaces in real time and respond effectively by referencing the suggestions of the reports.
Currently, each summary analysis is available only in Korean.
Container summary analysis
-
Basic information: It provides information about the container's startup time, restart count, and the affiliated Pod and namespace.
-
Container image: You can see how many containers are using the same container image as the one in use, and their total resource usage.
-
Node Information: It provides hardware information about the node where the container is running, such as OS, IP address, number of CPU cores, and memory size.
-
Resource usage: It provides the CPU and memory usage of the container and their utilization compared to the configured limit and request values.
Pod summary analysis
-
Basic Info: You can check the Pod's cluster name, namespace, startup time, current state (Phase), and such.
-
Kubernetes Events: You can check if any problem happened by looking at event logs related to the recent Pods.
-
Executor: It identifies the controller (DaemonSet, Deployment, etc.) that created the Pod.
-
Node Info: It provides detailed specifications of the node on which the Pod is running, including the operating system, kernel version, CPU, and memory.
-
Resource Usage: It displays the CPU and memory usage for all containers in the Pod, and the utilization compared to the set resource limits.
Node summary analysis
-
Basic information: It provides the cluster version of the node, startup time, current status, whether it is schedulable, internal IP address, region, and zone.
-
Operating system and hardware information: It provides the operating system on which the node is running, OS image, CPU architecture, number of cores, and total memory size. You can check the allocatability and current usage of the memory and CPU of a node.
-
Resource usage status: It displays the remaining resources through the difference between requests and allocatable resources (CPU, memory) for all containers running on the node. It summarizes the resource usage status, including the actual CPU and memory utilization.
-
Disk usage status: It provides information about the disks attached to the node, file system types, device IDs, mount points, total and used capacity, and utilization.
-
Pod status and resource availability: By comparing the total number of allocatable Pods on the node to the number of running Pods, you can see how many additional Pods can be run. In addition, the stability of the node is checked through the status of MemoryPressure, DiskPressure, PidPressure, and such.