Container Map Detailed Analysis
You can check detailed information about the target selected in the Container Map menu on the Detailed analysis screen.
-
In the Container map menu, select a block (container or pod) to view.
-
On the right of the screen, the View summarized panel appears as follows.
-
If you select the
 Detailed analysis at the upper right of the View Summary panel, the furthermore detailed information appears.
Basic screen guide
The Detailed analysis screen of the container map consists of the following. Basic information is available in the card and list formats. It provides Trace, Metrics, Log, and Event tabs for key monitoring data.
-
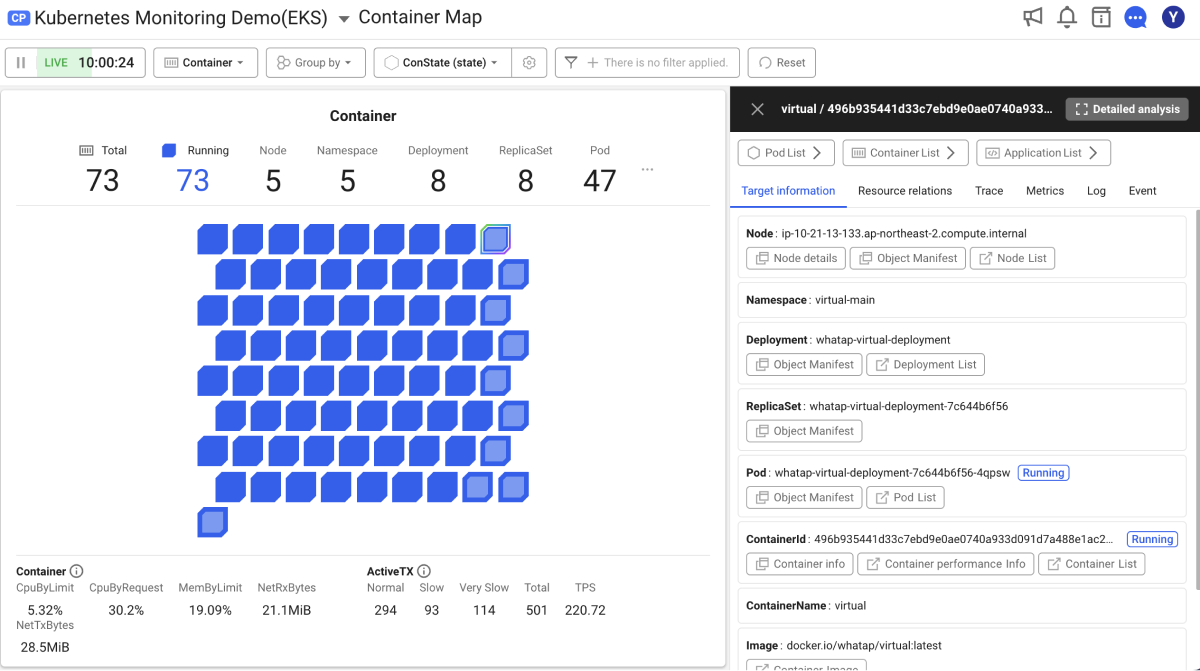
 Summary info card (container or pod)
You can see the group of the selected target. When selecting a target additionally, you can check the metrics for the selected target in the
 area. It has the same view as the card selected in the container map. For more information, see the following.Note
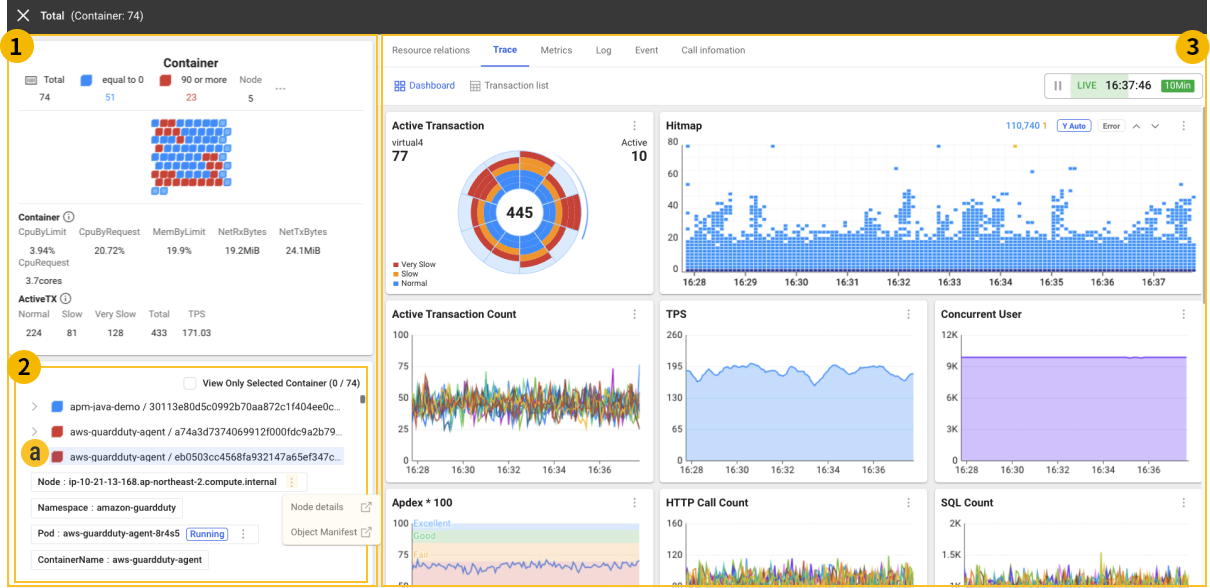
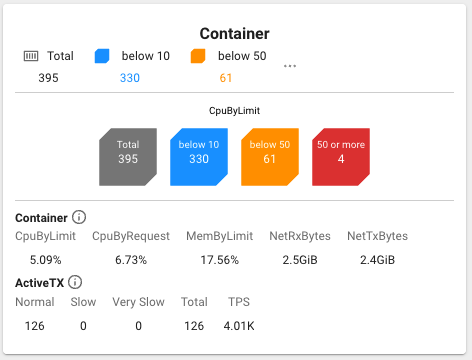
In case of a large number of blocks when searching the summary cards, the notation method changes as follows. You can compare all blocks, normal blocks, warning blocks, and fatal blocks.
-
 Target Info List
You can see the group information of the selected target in a list format. When selecting a target additionally, you can see the metrics for the selected target in the
area.-
If you check View Only Selected at the top of the
list, only the selected containers or Pods appear as follows: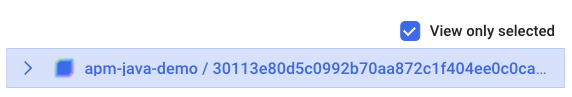
-
If you select
 More icon on the left of the list, the metrics for Node, Namespace, Deployment, ReplicaSet, Pod, ContainerName, ContainerId, Image, and Agent appear as shown in
  . For more information, see the following.
-
-
Resource relations, Trace, Metrics, Log, Event, Call Information
-
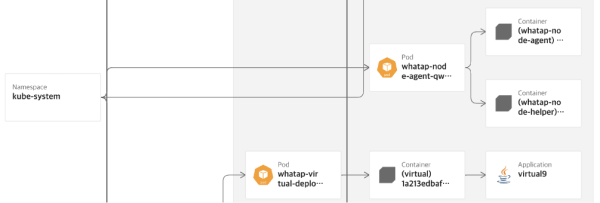
Resource relations
The Resource relationships tab allows you to visually see the connections between Kubernetes resources.
NoteThe relationship chart among Namespace, Deployment, ReplicaSet(DaemonSet), Pod, Container, and Application is provided as follows.
-
Trace
In the Trace tab, you can monitor the transaction data for active applications on the Kubernetes container. It provides the views for Dashboard and Transaction List. For more information, see the following.
-
Metrics
In the Metrics tab, you can check key metrics and resource usage patterns for the selected containers or pods. Through this, you can quickly identify resource issues and find optimization points. For more information, see the following.
-
Log
In the Log tab, you can see the logs generated from the Kubernetes containers and container applications. The logging functions are divided into the real-time container log searching and the past log searching. For more information, see the following.
-
Event
In the Event tab, you can see Kubernetes events that occur in a Kubernetes cluster and WhaTap events by the set conditions. For more information, see the following.
-
Call Infomation
In the Call information tab, you can see the call flow of the applications running on Kubernetes containers and the status of outbound call targets. For more information, see the following.
-