Call Information
The Remote Access Status inquiry function is provided only when the application is for Java.
Select Home > Select Project > Dashboard > Container Map > Target, and then in Detailed analysis, select the Call Information tab.
You can see the call flow of applications running on the Kubernetes container and the status of outbound call targets. The call information provided by WhaTap Kubernetes Monitoring is as follows:
-
App Call Flow
-
Remote Access Status
App Call Flow
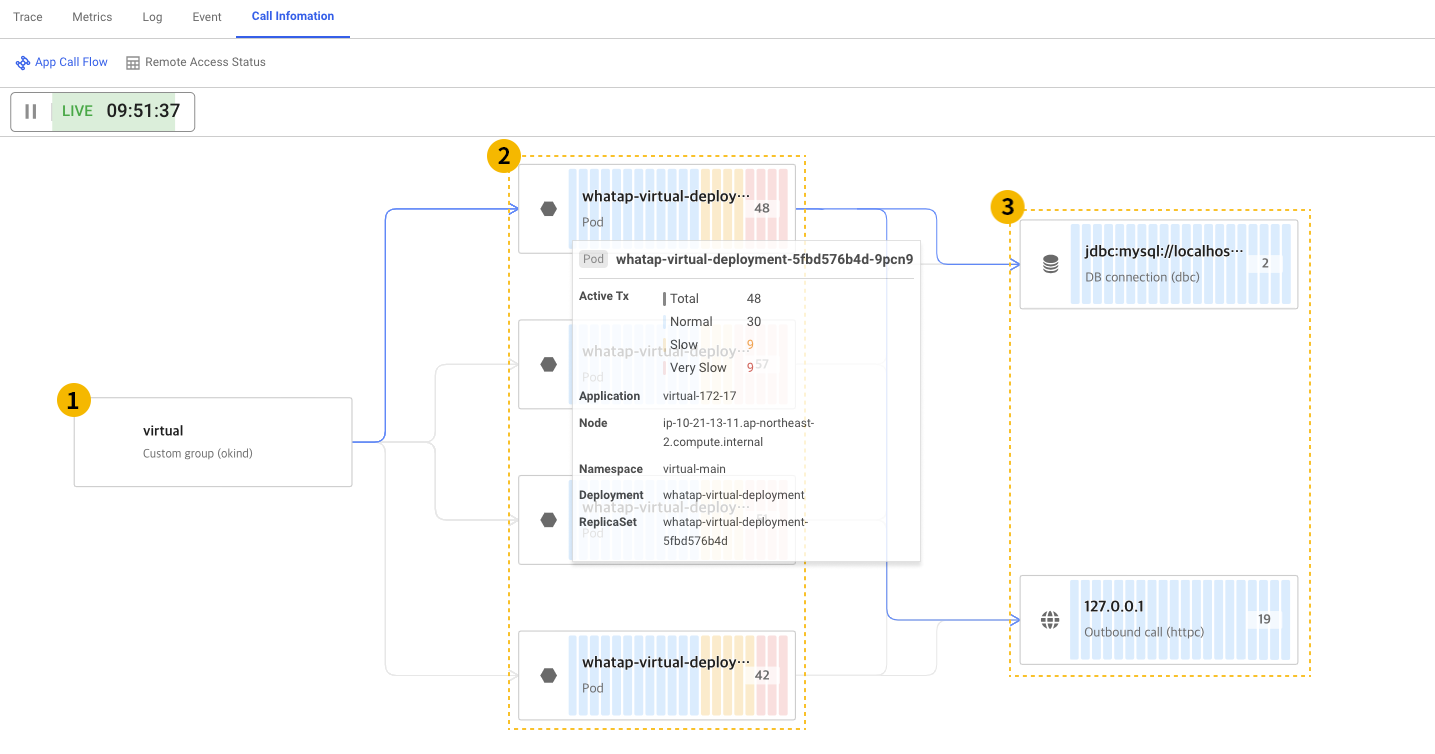
It provides a chart representing the call flow of container applications running inside Pod. You can check the connection relationship between three nodes: custom group (Okind), Pod, and DB connection (DBC) and outbound call (HTTPC). Each node provides the following data.
 Custom group (okind)
It is the name of the group specified by a user. If a group (okind) is not specified, the node does not appear.
 Pod
Pod
It indicates the name of the pod to which the container belongs. You can see the total number of active transactions and processing speed within the container application. After selection is made, Active transaction appears.
-
Active Tx: Indicates an active transaction withing the container application.
-
Total: Indicates the number of all active transactions withing the container application.
-
Normal: Indicates the number of transactions processed within 0 to 3 seconds.
-
Slow: Indicates the number of transaction processed within 3 to 8 seconds.
-
Very Slow: Indicates the number of transactions processed for over 8 seconds.
-
-
Application: Indicates the name of the application within the Pod.
-
Node: Indicates the name of the node that the Pod belongs to.
-
Namespace: Indicates the name of the namespace that the Pod belongs to.
-
ReplicaSet: Indicates the name of the ReplicaSet that the Pod belongs to.
-
Deployment: Indicates the name of the deployment that the Pod belongs to.
 DB connection and outbound call
-
DB connection (dbc): Indicates the DB connection called by the container application within the Pod. When selected, it goes to the Remote Access Status view tab.
-
Active Tx: Indicates an active transaction within a container application that is being connected to the database.
-
Total: Indicates the number of all active transactions withing the container application.
-
Normal: Indicates the number of transactions processed within 0 to 3 seconds.
-
Slow: Indicates the number of transaction processed within 3 to 8 seconds.
-
Very Slow: Indicates the number of transactions processed for over 8 seconds.
-
-
Outbound call (httpc): Indicates an external API called by the container application within the Pod. When selected, it goes to the Remote Access Status view tab.
-
Active Tx: Indicates an active transaction within the container application that is calling an external API.
-
Total: Indicates the number of all active transactions withing the container application.
-
Normal: Indicates the number of transactions processed within 0 to 3 seconds.
-
Slow: Indicates the number of transaction processed within 3 to 8 seconds.
-
Very Slow: Indicates the number of transactions processed for over 8 seconds.
-
Remote Access Status
Using the outbound call logs, the information on whether the outbound call target is normal is provided based on the connection status of the destination called by the monitored target. Through the Remote Access Status view function, the visibility to inaccessible targets is provided. Through this, you can easily identify the problem point when a service issue occurs. Additionally, any resource encroachment such as increased threads and connections due to continuous connection failures can be detected and responded in advance.
Remote Access Logs
This log records the success or failure events for outbound calls by monitoring target through the application agent configuration.
-
Outbound call types are as follows.
httpcall,db,socket -
To collect remote access logs, add the following options in Agent CONFIG..
logsink_rt_enabled=true
logsink_enabled=true
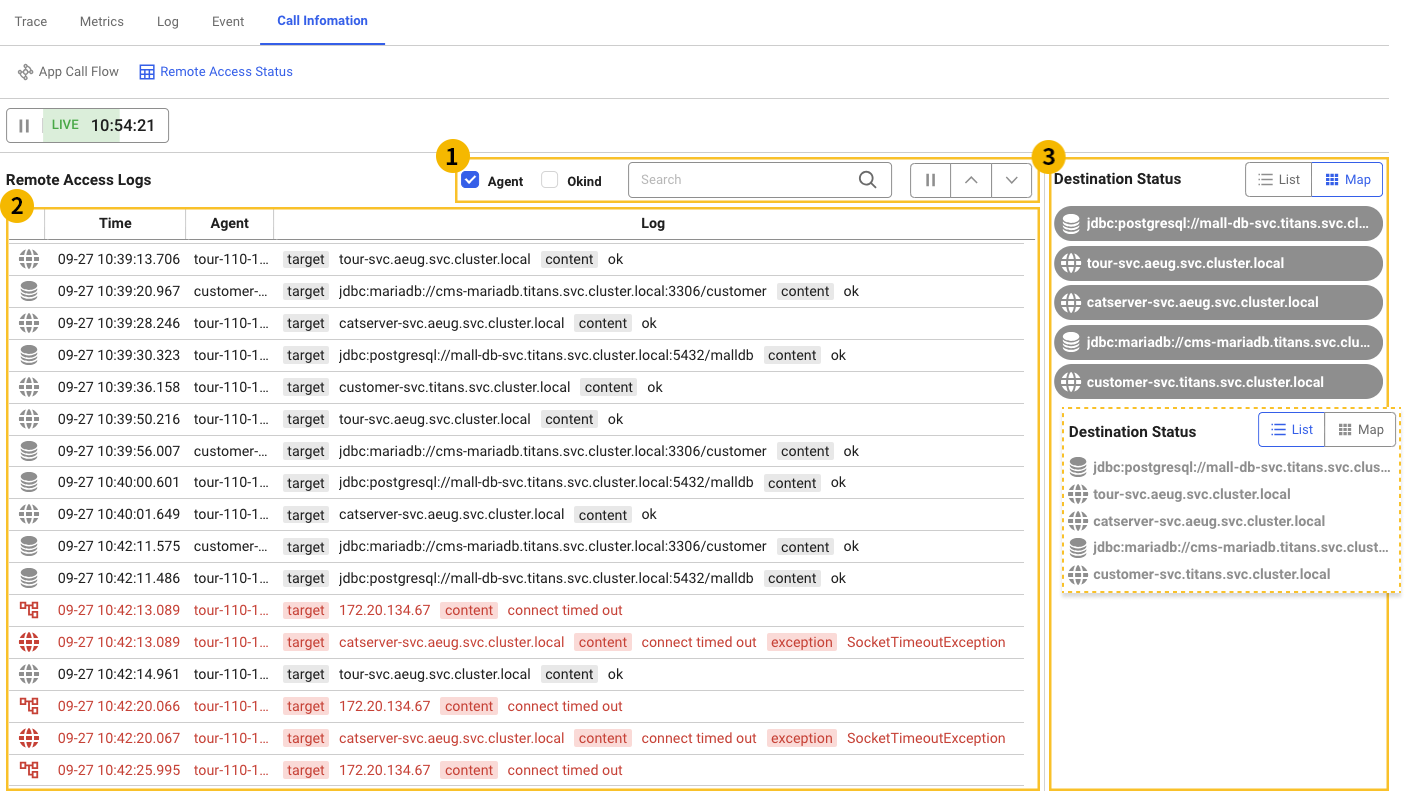
In the Remote Access Logs tab, remote access logs can be viewed in a list format. Up to 500 logs are loaded and displayed for the last 24 hours. When viewing in real time, data is updated every 3 seconds.
Options at the top bar
-
You can determine whether to display the Agent or BIZ. column.
-
Through the search term input field, you can filter columns containing agents, tasks, and logs to which the search term belongs.
-
 Play: If the logs have been updated, you can go to the bottom to check the most recent logs.
 -
 Pause: Automatic scrolling is stopped temporarily.
 -

 : Moves to the top or bottom.
Remote Access Logs
You can easily see the key content of the remote access logs through icons and tags. In case of an error log, it is displayed in red.
-
Outbound call types are guided through the icon
 (db),
(db),  (httpcall), and
  (socket).
 -
target: Indicates an outbound call and connection target. -
content: Indicates the log content. -
exception: Indicates the content of the log recorded when an error occurs.
Destination status
Check the list of outbound call targets for all viewed logs. Depending on the last connection status, Success or Fail appears.
-
View mode
-
List: Default list view. Scrolling occurs when the entire list exceeds the screen height.
-
Map: If the list goes beyond the screen height, the length of the list is shortened and outbound call targets are listed horizontally.
-
-
Filtering
When you select an outbound call target, you can see the list of remote access logs by filtering only the logs for the call targets. It is released when selected again.
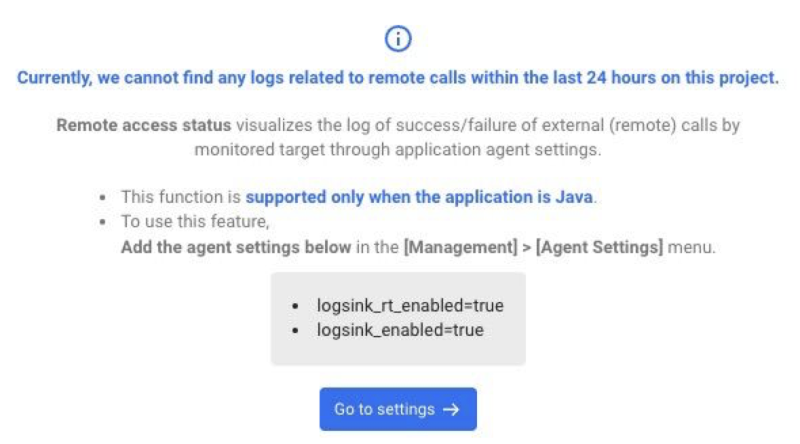
In case there is no data
Check whether remote access logs have been collected for the last 24 hours for real-time view. If no remote access log has been collected for the last 24 hours, the following guide message is provided.