Target grouping
Various groupings by user interests
The screen of the default Container Map menu displays all containers or pods. However, when observing the containers and pods in Kubernetes, there are many cases in which targets are selected and monitored based on the specific criteria. Of course, the criteria for looking at the target are very diverse. This is because users' interests in the Kubernetes environment are not all the same.
Server staff are interested in the node state for running Kubernetes resources. On the other hand, the application manager of a specific service is interested in the state of deployment, individual pods, or containers. After a new version release, you can monitor the overall status of deployment as well as the containers using a new image.
Therefore, grouping is provided to meet these diverse user needs.
-
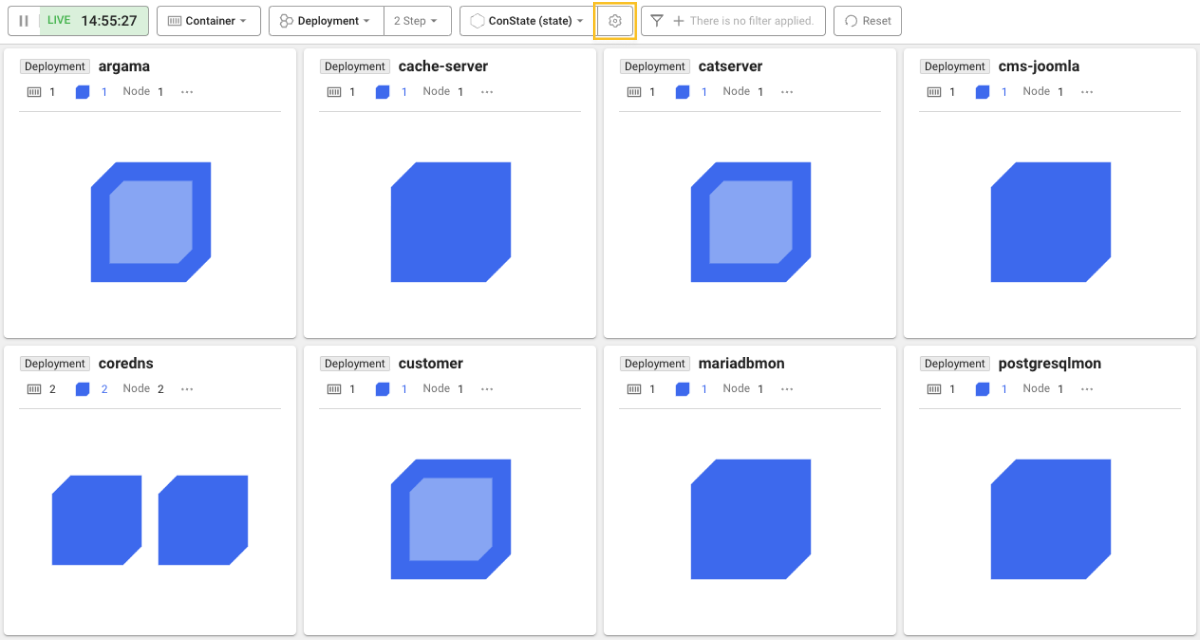
Per-container view + Node grouping

-
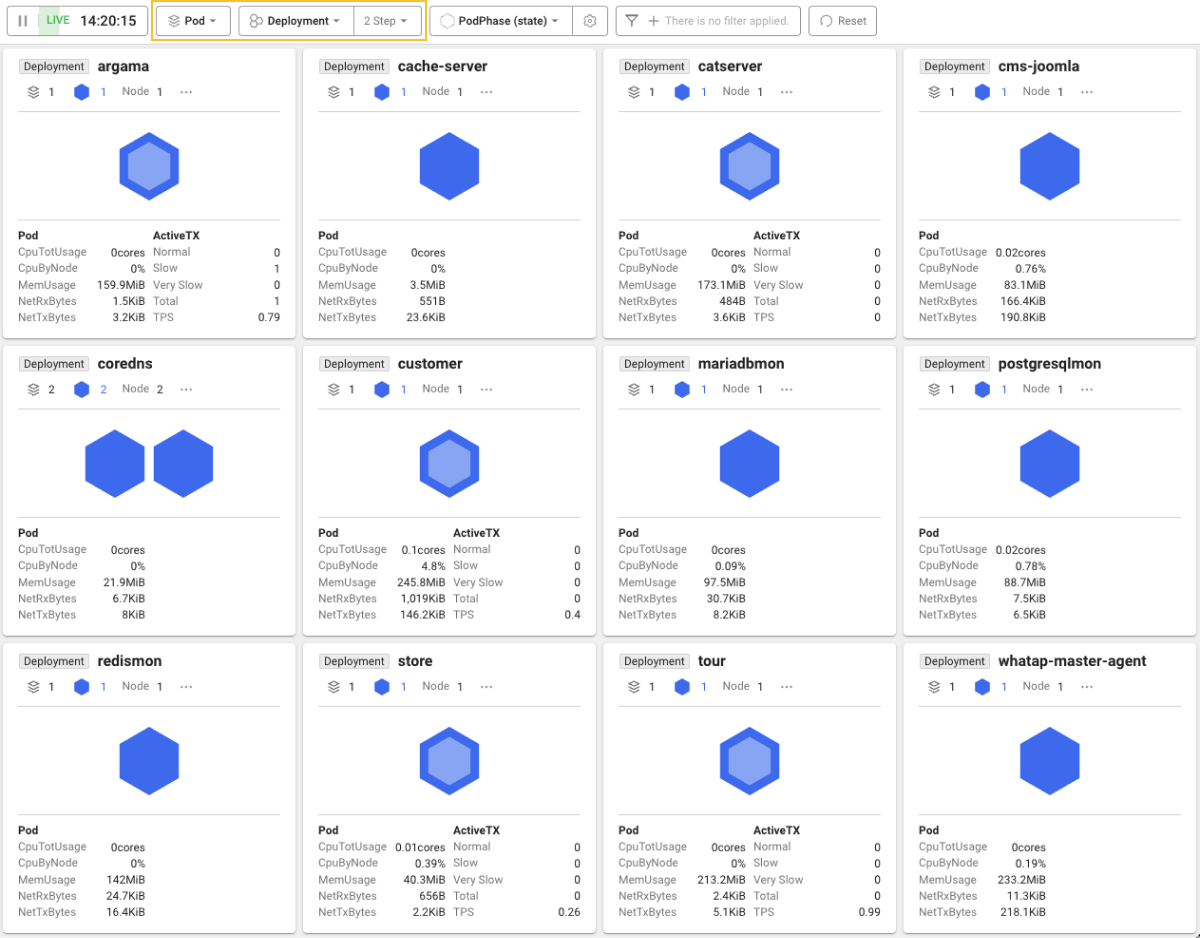
Pod-based view + Deployment grouping
Key grouping properties
The grouping properties supported depending on the container map view are as follows:
| Reference view | Grouping property |
|---|---|
| Container | Not set (All) Node Namespace Deployment ReplicaSet ReplicationController Pod ContainerName Image |
| Pod | Not set (All) Node Namespace Deployment ReplicaSet ReplicationController DemonSet StatefulSet |
The grouping settings (including the attribute fields and filtering options) on the screen are stored in the user browser. To initialize the stored settings, select ![]() Reset.
Reset.
Grouping & Card
A container map consists of one or more cards. If grouping is not applied, all containers/pods in the project are represented in a single large card. Grouping organizes the cards into individual groups.
The above screen displays grouping based on the deployment as the reference property. You can see that the cards are listed for each deployment.
When grouping is applied, the objects that cannot be grouped by the reference property do not appear by default. However, there is a way to make those objects visible on the screen as well. On the screen select the ![]() setting button. If Hide unknown groups is unchecked, only the objects that do not fall under grouping are collected and represented as separate cards.
setting button. If Hide unknown groups is unchecked, only the objects that do not fall under grouping are collected and represented as separate cards.
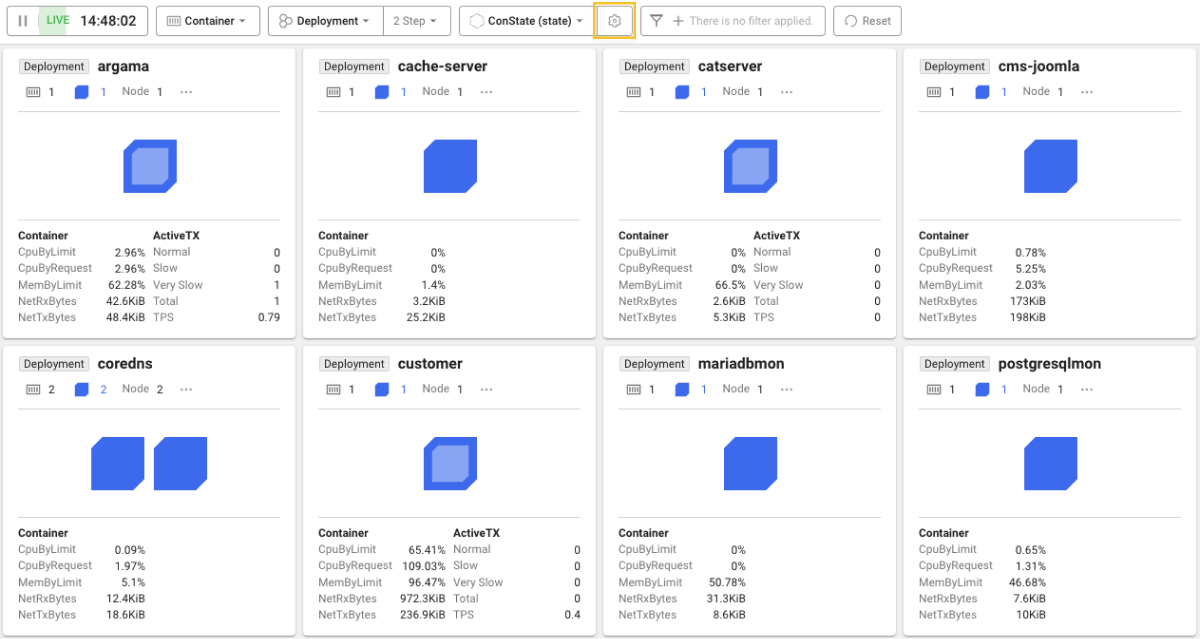
Metrics data by card
Metrics data for grouped targets appears under each card. The following lists the provided metrics:
| Reference view | Resource metric | Application metrics |
|---|---|---|
| Container | CpuByLimit CpuByRequest MemByLimit NetRxBytes NetTxBytes | Normal TX Slow TX Very Slow TX Total TX TPS |
| Pod | CpuTotUsage CpuByNode MemUsage NetRxBytes NetTxBytes |
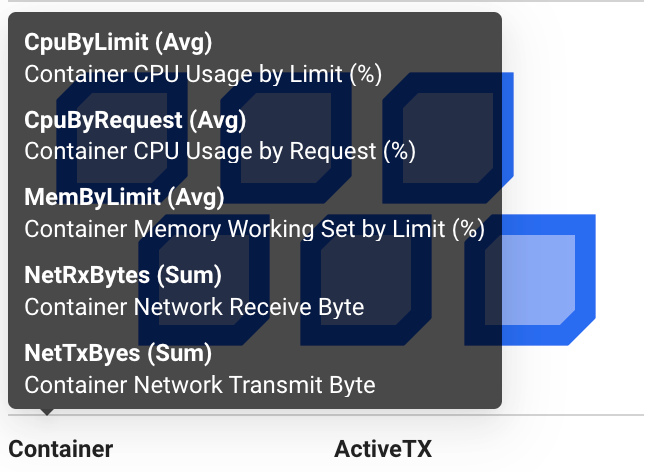
If the cursor is over the container (or pod) or ActiveTX, you can check descriptions for each metric in a pop-up.
-
Among the metrics displayed in the pop-up, the items with Avg mean that the metrics values of the same names under the card are the average values of individual targets within the group.
-
Among the metrics displayed in the pop-up, the items with Sum mean that the metrics values of the same names under the card are the sum of individual targets within the group.
Hiding the metrics data of the card
You can hide metrics data under the card and focus only on the chart. On the screen select the ![]() setting button. Uncheck Show Metrics Below Card. This function is useful when you have a large number of cards.
setting button. Uncheck Show Metrics Below Card. This function is useful when you have a large number of cards.
You can hide metrics data as follows: