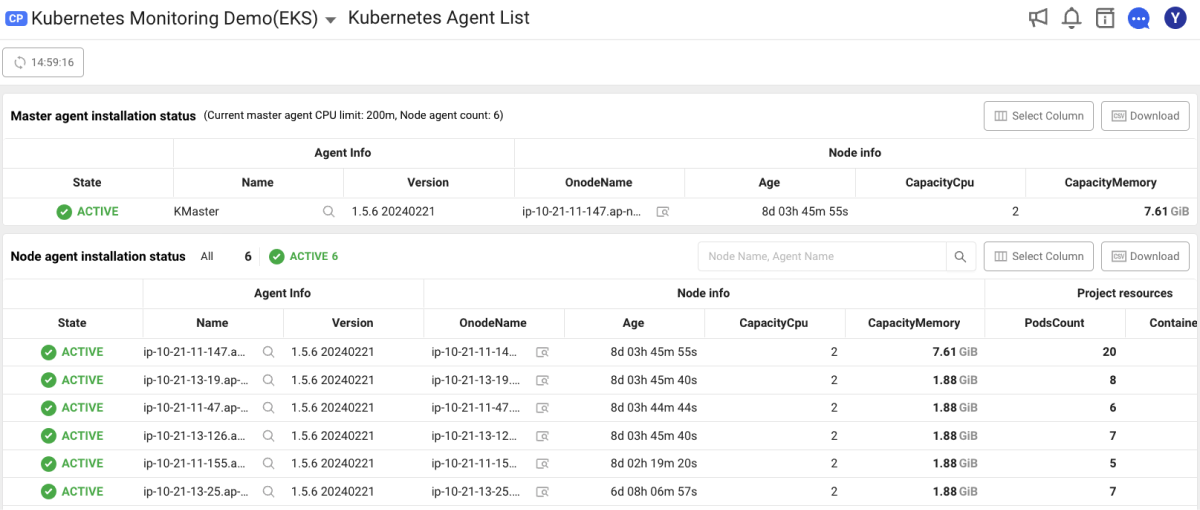
Kubernetes Agent List
Select Home screen > cluster project (CP) > Management > Kubernetes Agent List
Under the Management menu of the cluster project (CP), you can go to the Kubernetes Agent List menu.

-
You can see the installation progress of the Kubernetes agent. If some agents are not installed (UNINSTALLED) or inactive (INACTIVE), data collection may be distorted, so quick checking is required.
e.g. UNINSTALLED, ACITVE, INACTIVE in the State column
-
You can check the CPU Limit assigned to the master agent and the installed node agent count.
For example, if the node agent count is 50 or more, it is recommended to set the master agent's CPU Limit to 500 millicores or more.
-
You can see the CPU and memory allocated to the node where the agent has been installed.
e.g. CapacityCpu, CapacityMemory under the Node Info column
-
You can see the nodes on which the agents are not installed.
-
You can see the key data of the agent.
-
You can find the guide to the node agent version.
e.g. Mismatch notification upon version discrepancy between nodes
Master agent's resource allocation
Because the amount of data collected and processed by the WhaTap agent differs depending on the size of the user's Kubernetes environment (or node count), sufficient resource allocation to the master agent is required. For example, if node agent count is so great, it is recommended to increase the master agent's CPU limit.
Refresh
If the Refresh icon is selected at the top, you can update the data based on the current time.
Select Column
| Group | Column name | Description |
|---|---|---|
| Agent Info | Name | It indicates the agent alias when the agent name or agent alias is set. |
| Original Name | It is the agent name. It is usually the same as the node name. | |
| Alias | It indicates the custom agent's alias. | |
| Initial | It is an abbreviation used when indicating the agent. | |
| Id | It is a unique ID of the agent. | |
| Start Time | It is the time when the agent first started running. | |
| Active Time | It is the time when the agent is currently active and starts collecting the monitoring data. | |
| Inactive Time | It is the time when the agent became inactive and data collection stopped. | |
| Version | It is the current software version of the agent. | |
| IP | It indicates the IP address of the server where the agent has been installed. | |
| CPU Cores | It indicates the number of CPU cores on the server where the agent has been installed. | |
| Node info | OnodeName | It is the name of the node where the agent has been installed. |
| Onode | It is a hash value that has converted the name of the node where the agent has been installed. | |
| Age | It indicates the time elapsed since node creation. | |
| CapacityCpu | It indicates the total CPU capacity of the node. | |
| CapacityMemory | It indicates the total memory capacity of the node. | |
| Project resources | PodsCount | It indicates the number of Pods running on a node where the node agent has been installed. Separated namespaces are excluded. |
| ContainersCount | It indicates the number of containers running on a node where the node agent has been installed. Separated namespaces are excluded. |
When using the Select column option, you can select a desired agent to view the agent list.
-
The selected column list is kept even if you re-enter the menu.
-
If you select Reset, the predefined default key metric columns are selected. In this case, the column selection history is deleted.
-
After selecting a column, you can click Apply at the lower right to apply the selected values.
Download
If the Download icon is selected, you can download the data in the CSV format by setting the range and display option.
Display Detail
If you select the icon in the master agent's Detail column, the detailed information window appears on the right. You can see the environment variables, heap histograms, thread list/dump, and agent logs.
In the node agent list, if you select the icon in the Detail column of the agent to view, the detailed information window for the node appears on the right.
For more information about the node details, see the following.