Performance Trend
Home > Select Project > Analysis > Performance Trend
On the initial screen of the WhaTap Monitoring service, select a project and then click Analysis > Performance Trend. You can see numerous metrics about the performance within the specific time range to view.
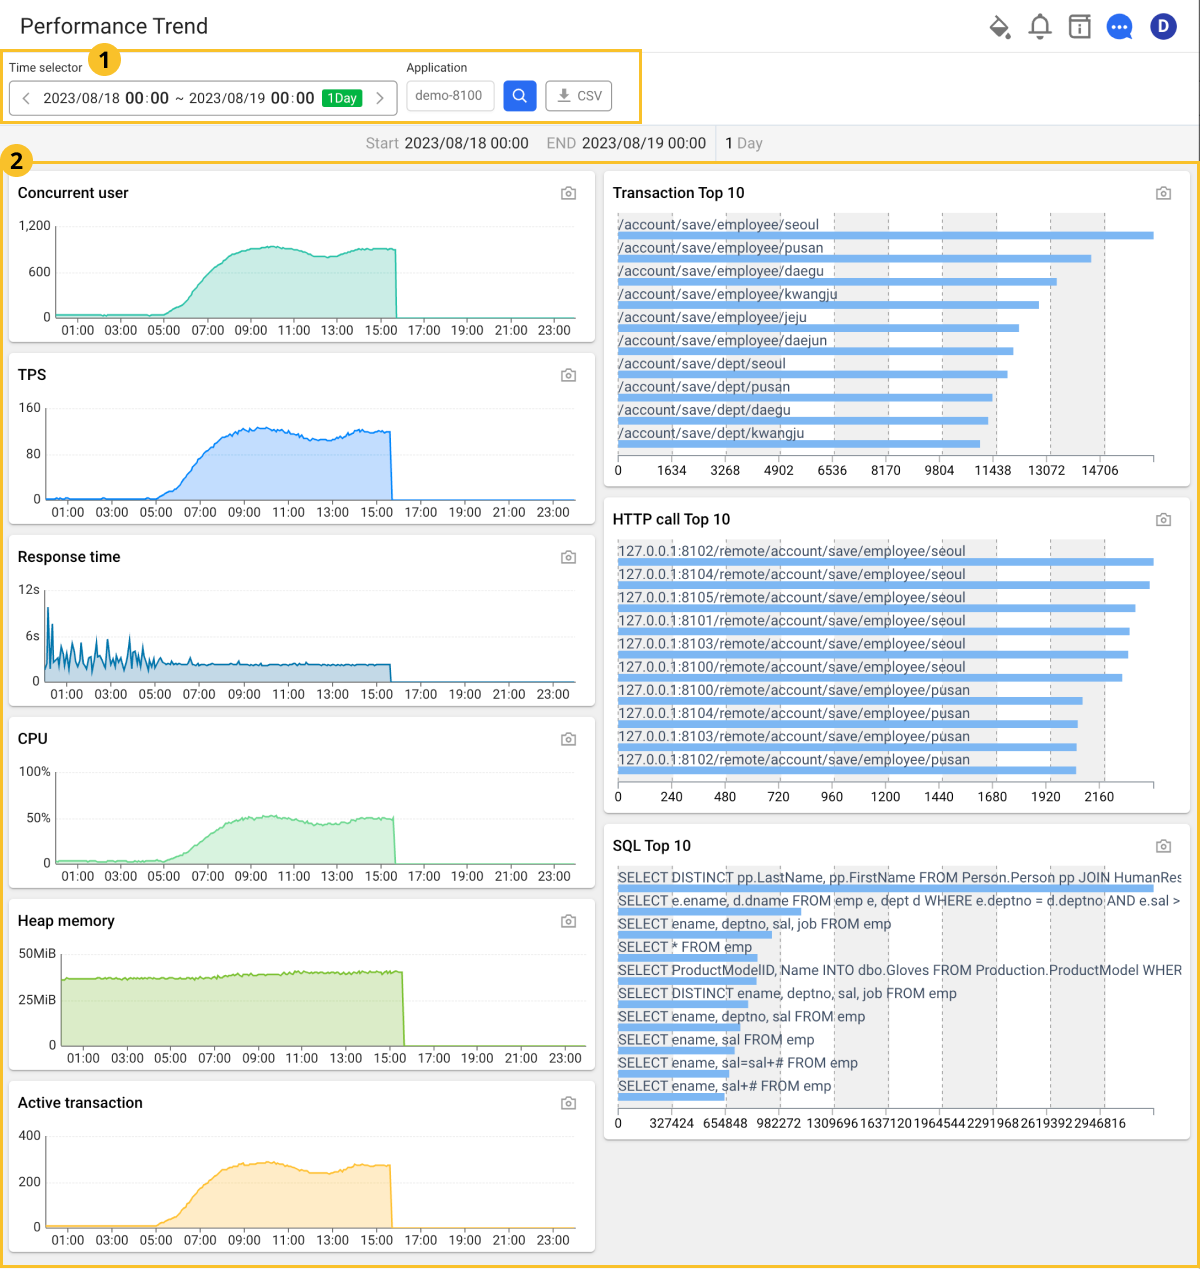
 Performance trend search conditions
-
The time selector allows you to select a time range to search. The default search period is 1 day.
-
If the selected range is 3 hours or less, a 5-second trend is displayed using raw data.
-
If the selected range is within 3 days, a 5-minute trend is displayed using 5-minute statistics.
-
If the selected range exceeds 3 days, a 1-hour trend is displayed using 1-hour statistics.
-
-
The application selector allows you to select all or specific applications to view.
-
Select
 CSV download icon, you can download the list data displayed on the screen as a CSV file.
 Performance Trend Chart
-
You can see the specified lookup time range at the top of the chart.
-
In the chart area, you can see the Concurrent user, TPS, Response time, CPU, Heap memory, Active transaction, Transaction, Top 10, HTTP call Top 10, SQL Top 10 and such.
-
By selecting the
 Snapshot icon, you can snapshot charts except for widget options.
Concurrent user
Real-time users are counted based on unique browser IP addresses.
-
When using raw data, the number of unique browser IPs that sent requests within 10 seconds is counted.
-
When using 5-minute statistics, the number of unique browser IPs that sent requests in the past 5 minutes is counted.
-
When using 1-hour statistics, the number of unique browser IPs that sent requests in the past hour is counted.
TPS
TPS (Transaction Per Second) means the number of transactions processed per second.
Response time
It indicates the average response time for requests. If the average is very high, there may be many slow transactions or failures at any specified time.
CPU
It indicates the CPU usage of the application server. You can see the trend in usage change.
Heap memory
It indicates the heap memory usage of the monitored process. The changes in memory usage over time can be seen.
Active transaction
Active transaction indicates a transaction in progress. For more information about active transactions, see the following.
Transaction Top 10
We use the transaction call statistics to provide you with the top 10 list with the most frequent transaction calls.
HTTP call Top 10
We use the HTTPC statistics to provide the top 10 list with the highest numbers of HTTP call URLs.
SQL Top 10
It provides the top 10 list with the highest numbers of SQL calls using SQL statistics.