Instance Performance Management
Home > Select Project > Instance Performance Management
You can see the application environment along with the performance-related settings. You can see detailed information of agents and applications.
-
You can filter the desired items through the text field on the upper right of the screen.
-
If changes to agents and applications located on the monitored server are not automatically applied, select
 Refresh.
Agent list
You can check the list of agents assigned to the project in the application list on the left of the screen. If you select an individual agent, you can view information for environment variables, agent settings, and performances set on the right of the screen.
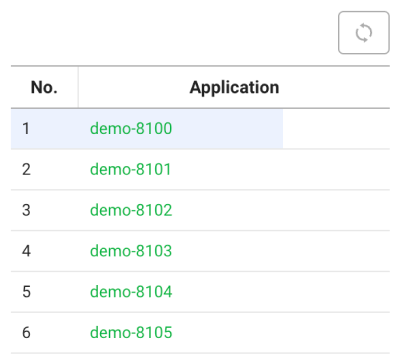
After updating the agent list or restarting a disabled agent, if it is not automatically displayed in the list, select ![]() .
.
Runtime ENV. Variable
Home > Select Project > Instance Performance Management > Runtime ENV. Variable
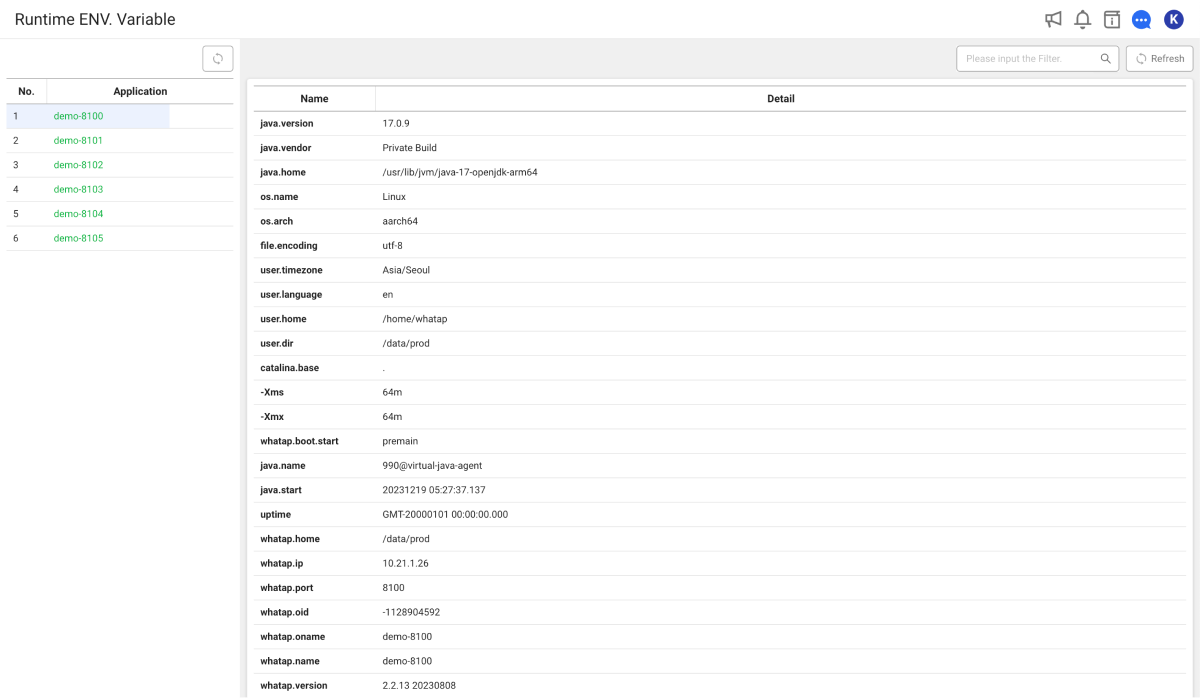
You can view environment variables for agent execution. Important information among environment variables or application status can be stored on the WaTap server so that they can be retrieved even if the agent is down. You can see the version, installation path, name, and IP address of the agent. You can download environment variables by clicking Download CSV. The following are key points to check:
-
(Application).version: You can check the application version. -
file.encoding: You can check the file encoding format such asutf-8. -
os.name: You can check the current OS. -
user.language: You can check the user language.
-
-Xms,-Xms: You can check environment variables that are related to heap memory settings. -
(Application).start: You can check the application start time.
System ENV. Variable
Home > Select Project > Instance Performance Management > System ENV. Variable
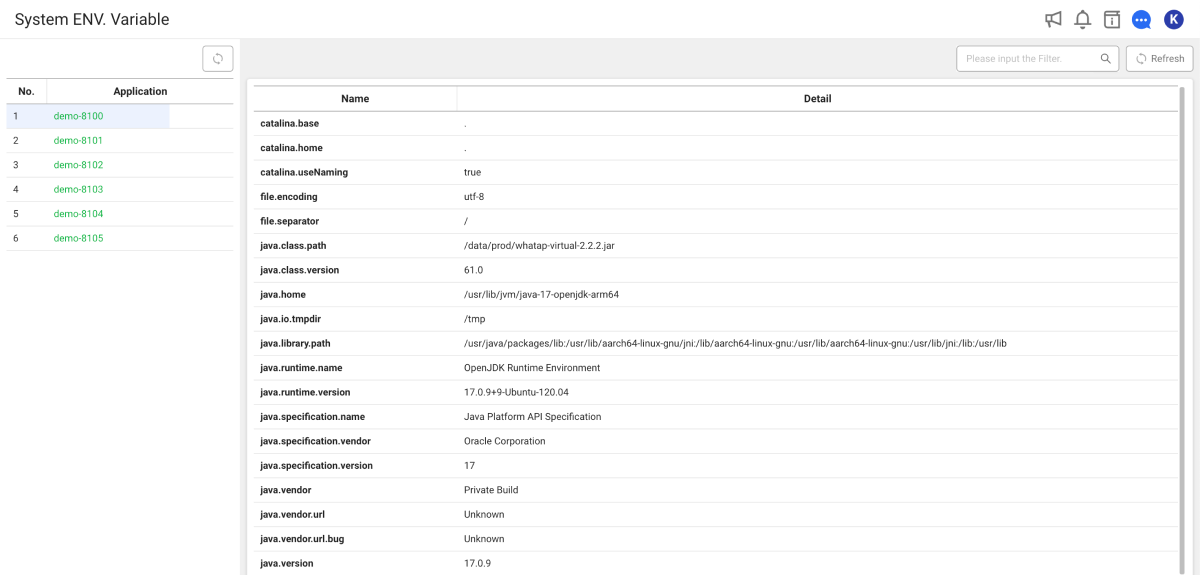
You can view environment variables for application execution. The Boot environment menu collects and provides environment variables at the time of query. It uses System.getProperty() to retrieve the value of the key passed as a parameter. The following are key points to check:
-
(Application).version: You can check the application version. -
file.encoding: You can check the file encoding format such asutf-8.
- Application state: For example, if the
catalina.homeenvironment variable is retrieved, you can see that it is the tomcat environment.
- OS environment variables: For example, they are provided in the suffix
(env)format, such as(env) LANGenvironment variable.
Heap Histogram
Home > Select Project > Instance Performance Management > Heap Histogram
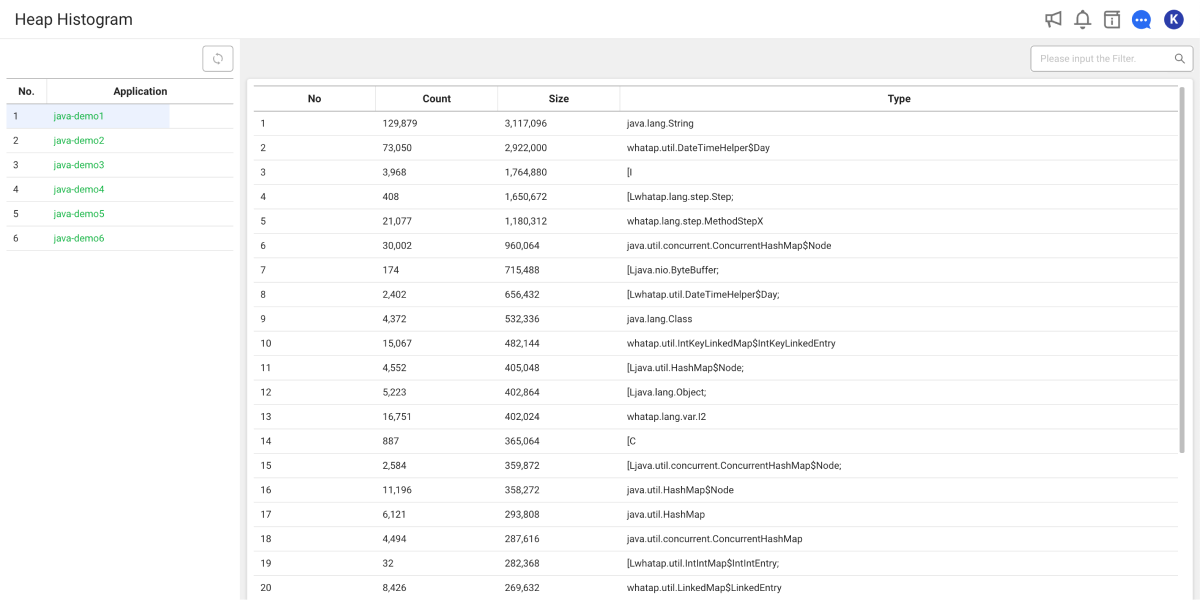
You can view the status of heap occupied objects (sizes for each object in heap memory) in the memory of the JVM (Java Virtual Machine). It retrieves the pure size of the object. Through the Count column, it is easy to check the number of main objects.
Because it retrieves the number of objects that are kept until GC, they appear in the list even if they are not actually used. For an accurate query, it is recommended running System GC and then checking the list. For more information about System GC, see the following.
Java versions 6 to 8 support basic functions without the JVM options. However, for some Java versions, the JVM options must be applied as follows:
-
Java 9 to Java 15
-Djdk.attach.allowAttachSelf=trueexamplejava -javaagent:{WHATAP_HOME}/whatap.agent-X.Y.Z.jar -Djdk.attach.allowAttachSelf=true -jar {application.jar} -
Java 16 or later
-Djdk.attach.allowAttachSelf=true
--add-opens=jdk.attach/sun.tools.attach=ALL-UNNAMEDexamplejava -javaagent:{WHATAP_HOME}/whatap.agent-X.Y.Z.jar -Djdk.attach.allowAttachSelf=true --add-opens=java.base/java.lang=ALL-UNNAMED --add-opens=jdk.attach/sun.tools.attach=ALL-UNNAMED -jar {application.jar} -
It does not support Java 5 or earlier and IBM Java.
Loaded Classes
Home > Select Project > Instance Performance Management > Loaded Classes
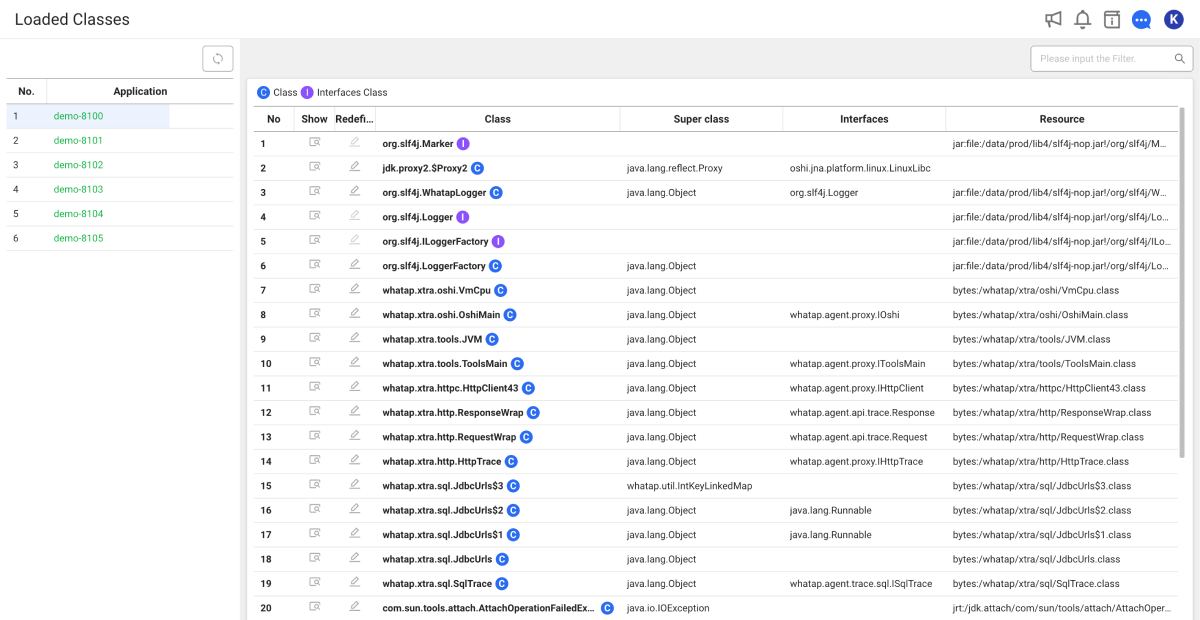
You can see class information loaded in Java applications. The Loaded Classes menu allows you to retrieve the list of classes loaded into your application and their detailed data, and to change the behaviors of classes without interruption.
-
Class details: When you click the
 icon in the Class details column, you can see Class details. The Class details provides information about methods and inheritance relationships within the class.
 -
Redefine: If you click the
 icon in the Redefine column, the class can be redefined. You can change the behaviors of the class that has been loaded at runtime without stopping the application by reloading it and then using the byte code injection (BCI).
 -
Resource: You can check which physical file the class was loaded from. Due to the complex multi-layered nature of the application, we need to check the Resource information to determine which jar file a class was loaded from.
For more information about using the Redefine feature and Resource, see the following.
BCI(ByteCode Instrumentation)
Java bytecode is a platform-independent intermediate code that runs on the JVM. BCI (byte code injection), is a technique to implement additional functionality by dynamically changing the bytecode at runtime or build time without modifying the source file. For more information, see the following document.
Library Version
Home > Select Project > Instance Performance Management > Library Version
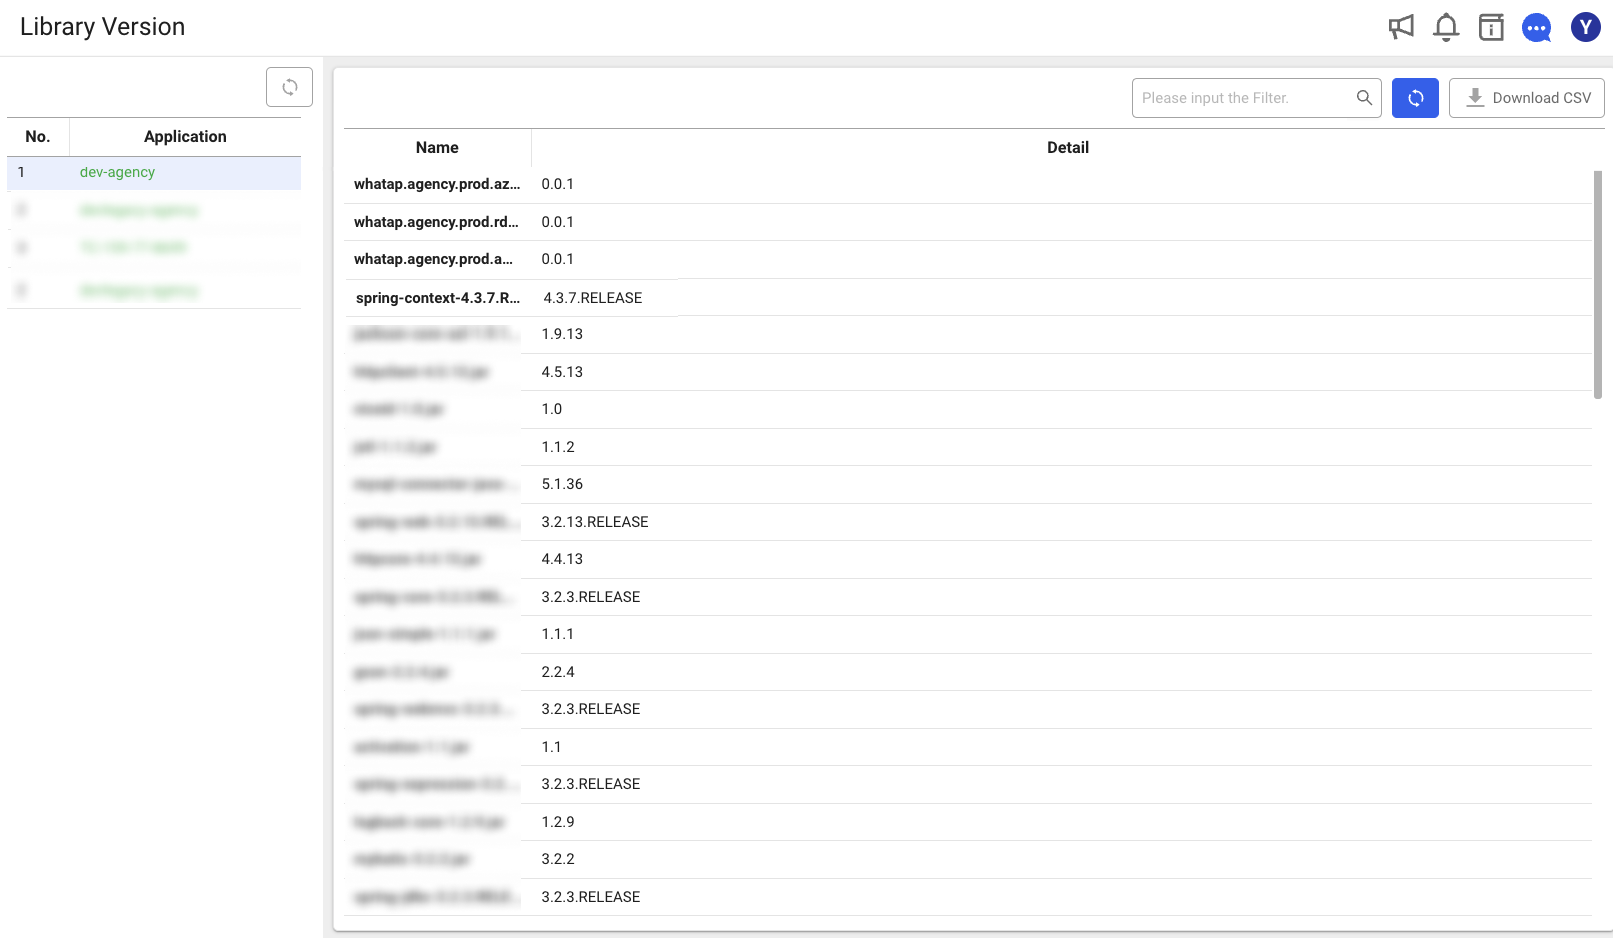
You can view a list of components deployed to the Java application. In the environments with lots of open source libraries, you can quickly check and resolve compatibility issues by checking the version of the jar file. Additionally, checking the version makes it easy to manage security, such as finding and patching versions with security vulnerabilities.
-
Component list Info: It provides Name and version for the corresponding jar file in Detail.
-
Download CSV: You can download the version information by clicking Download.
Thread List/Dump
Home > Select Project > Instance Performance Management > Thread List/Dump
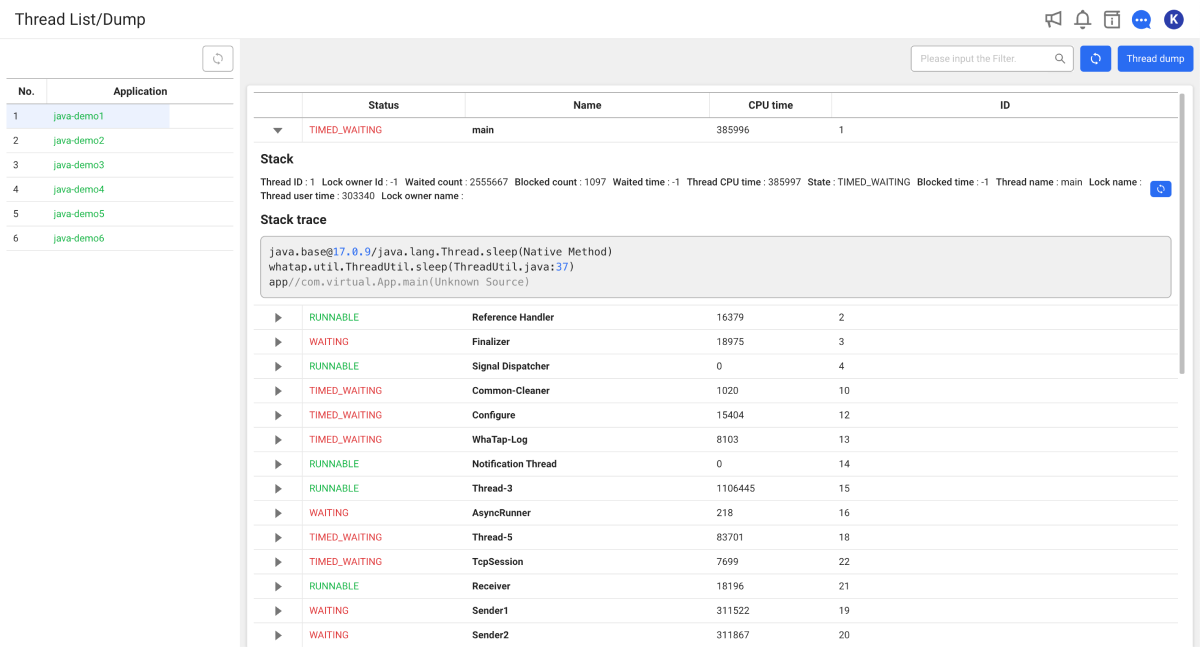
It can provide snapshot information of all threads in the Java process. Thread List/Dump is a key menu for CPU optimization. You can manage CPU resources more finely by checking the status at the thread level rather than the process level. For example, you can identify performance issues by checking the thread that is using the most CPU at the time of query and then checking the stack information for the thread.
-
Thread status: You can see the Number of all threads and the number of threads in RUNNABLE and WAITING status through the status summary at the top of the list.
-
Thread dump: You can create a full thread dump by clicking
Thread Dumpon the upper right. After generating a full thread dump, you can check the information at the bottom of the thread list. -
Individual thread dump: You can see individual thread dump information by selecting the
 icon for each thread. You can view the details and stack traces about the thread state and execution path, in Stack and Stack trace.
  The list can be checked after refreshing it. For more information, see the following.
 -
In Thread CPU time: It indicates the total accumulated time that the thread has occupied the CPU. It uses the time in milliseconds.
-
Increment: If you click the
Refresh icon at the top of the thread list, the difference between the CPU time of the existing thread and the CPU time of the current thread is added.
Thread CPU time is the total accumulated time that the thread has occupied the CPU. Therefore, to identify the thread that is using the most CPU at the query time, it is required to check the Increment value. For more information, see the following.
CPU usage spike types
-
Heap memory is full: CPU usage spikes due to frequent GC.
-
There are lots of requests: CPU usage spikes due to processing a large number of client requests.
-
Wrong code logic: Inefficient algorithms or infinite loops can cause spikes in CPU usage.
Analyzing the thread dump
It guides you to individual thread dumps that can be checked in Thread list/dump.
Thread status
The states of the thread are declared as enumerated types named State in the java.lang.Thread class.
-
NEW: The thread has been generated but not run. -
RUNNABLE: The CPU has been occupied and the tasks are being performed. The resource allocation by the OS may result inWAITINGstate. -
WAITING: It is waiting using thewait(),join(), andpark()methods. -
TIMED_WAITING: It is waiting using thesleep(),wait(),join(), andpark()methods. The difference from theWAITINGstate is that it is waiting for a given time. The waiting state can be released by the time as well as external environment change. -
BLOCKED: It is waiting for the locked object to be released. -
TERMINATED: Execution has been completed.
Thread dump information
You can check individual thread dumps by selecting the  button for each thread in the thread list.
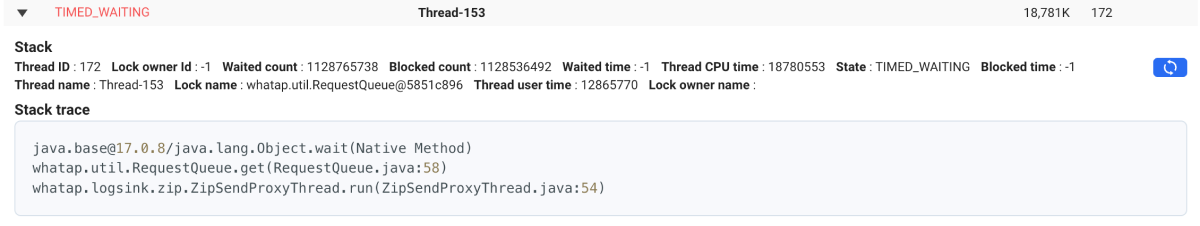
Stack
| Item | Properties | Description |
|---|---|---|
| Thread ID | threadId | Unique ID allocated to the thread |
| Lock owner Id | lockOwnerId | Thread ID that holds the monitor lock state on the object on which the threads are blocked. |
| Waited count | waitedCount | Total number of WAITING and TIMED_WAITING states of the thread |
| Blocked count | blockedCount | Total number of Blocked states of the thread |
| Waited time | waitedTime | Elapsed time (milliseconds) that the thread has been in the WAITING state. It returns -1 when the thread contention monitoring is disabled. |
| Thread CPU time | threadCpuTime | It displays the total CPU time (nanoseconds) of the thread calculated in milliseconds. It returns -1 when the CPU time measurement is disabled. |
| Status | threadstate | Thread status |
| Blocked time | blockedTime | Elapsed time (milliseconds) that the thread has been in the BLOCKED state. It returns -1 when the thread contention monitoring is disabled. |
| Thread name | threadName | Unique name of the thread |
| Lock name | lockName | String indicating that the thread's input is blocked or a monitor lock prompts for notification via the Object.wait method. |
| Lock owner name | lockOwnerName | Name of the thread that holds the monitor lock on the objects on which the thread is blocked. |
| Thread user time | threadUserTime | The CPU time (nanoseconds) for which the thread executed in user mode that is calculated in milliseconds. |
For more information about the thread information, see the following link.
Stack trace
It displays the stack trace when any exception occurs. The stack frame list that contains information about the methods called by the code.
Opened Socket Count
Home > Select Project > Instance Performance Management > Opened Socket Count
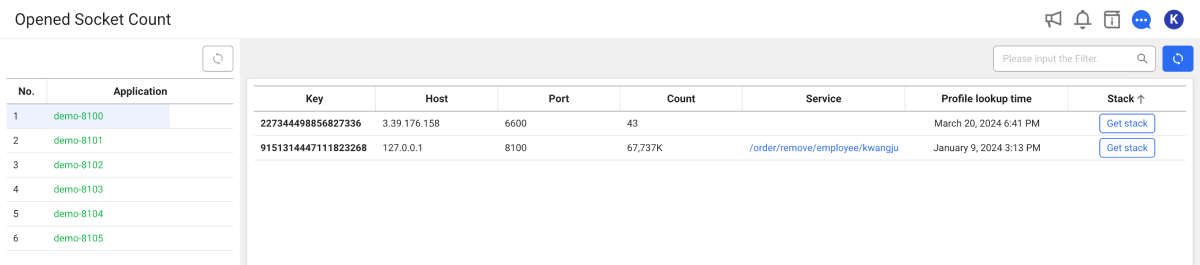
You can check the socket information that the Java application opened to perform TCP features. This can be used to view the network dependency, which is the external system that the application instance depends on, such as database. You can also trace who it is making outbound calls to. This information is important for optimizing the efficiency, reliability, and performance of TCP communications.
-
Count: It indicates the number of connection attempts to external systems.
-
Stack: By selecting Get stack, the stacks acquired on the next connections can be viewed and deleted.
It can sort by Count and then check Host and Port to find which services or systems have the most connections. Afterwards, obtain Stack to view the detailed content.
Database and connection pool
For example, if the Count of 3306 Port increases, it is possible that MySQL is not managing connections properly, such as not using the connection pool or frequently disconnecting and recreating the connection pool. To check whether the 3306 Port is being used in which code path, you can obtain Stack for tracing.
Method Performance
Home > Select Project > Instance Performance Management > Method Performance
It provides the performance statistics about the method executed in the Java application.
-
Refresh: It recalls the data.
-
Reset: It initializes the statistical data for the registered methods.
To use the Method Performance menu, add the following custom options in Agent CONFIG.. In the reboot or Loaded Classes menu, perform Redefine.
hook_method_stat_patterns=io.home.test.baseapp.app.post.mapper.PostMapperImpl.*
DataSource Status
Home > Select Project > Instance Performance Management > DataSource Status
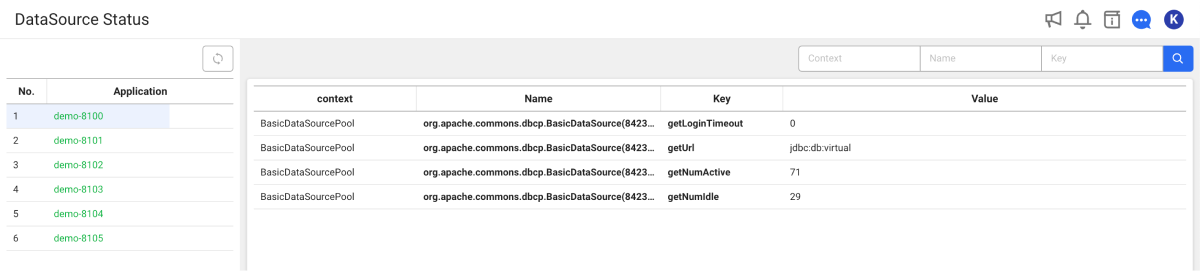
You can see the status of DataSource. It provides information for current status and configuration of the database connection pool used by the application, connection settings, connection state, and configuration mismatches.
Because the monitoring starts as soon as a connection pool object is created, it may appear in the data source status even if the object is not being used.
Agent log
Home > Select Project > Instance Performance Management > Agent Log
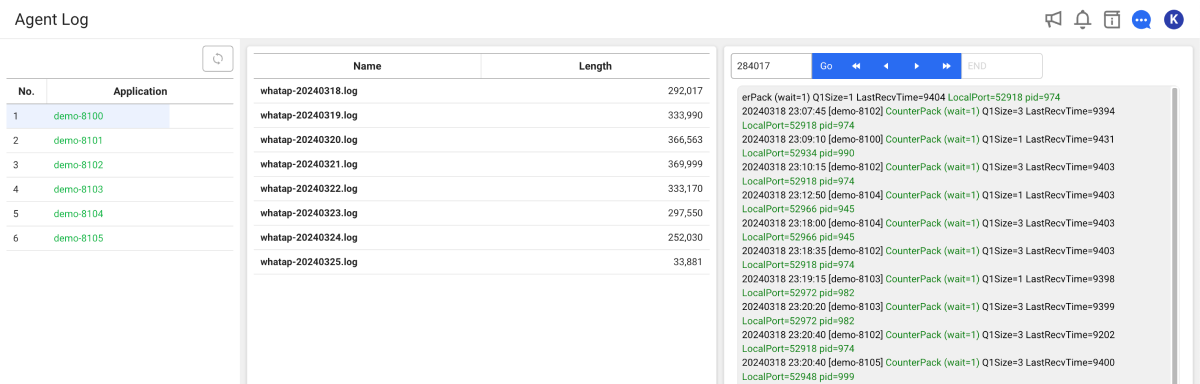
You can view the agent logs stored on the monitored server. The name of the log file is in the format of whatap-YYYYMMDD.log. You can select each log to access information about the errors and events captured in the logs.
For the agent settings for the log, see the following.
System GC
Home > Select Project > Instance Performance Management > System GC
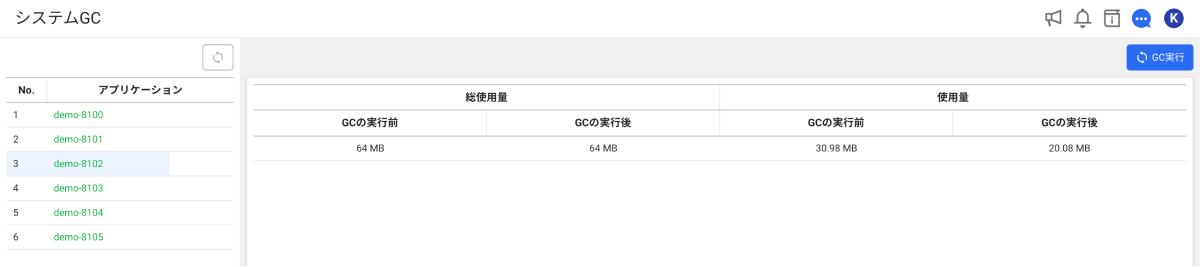
By calling System.gc(), you can collect and remove memory objects (garbage) that are no longer needed for the dynamically allocated memory in the Heap area of the JVM (Java Virtual Machine). If you select Run GC, the GC process is performed and you can see the memory capacities before and after execution.
If the option has been set to disable explicit GC requests, such as -XX:+DisableExplicitGC, System GC does not work.
System GC and memory leak
When the heap memory usage continues to rise, the System GC is required to accurately identify and diagnose the possibility of memory leak.
-
Memory requested or not: Check if the application is continuously requesting memory. Check if memory requests increased more than expected or memory is being freed correctly.
-
Checking memory usage: Check if excessive memory usage is happening. Run GC to free objects that are no longer required and observe changes in memory usage.
-
GC cycle: Check if GC is not running even if there is sufficient free memory. Check the GC cycle or settings.
Heap Dump
Home > Select Project > Instance Performance Management > Heap Dump
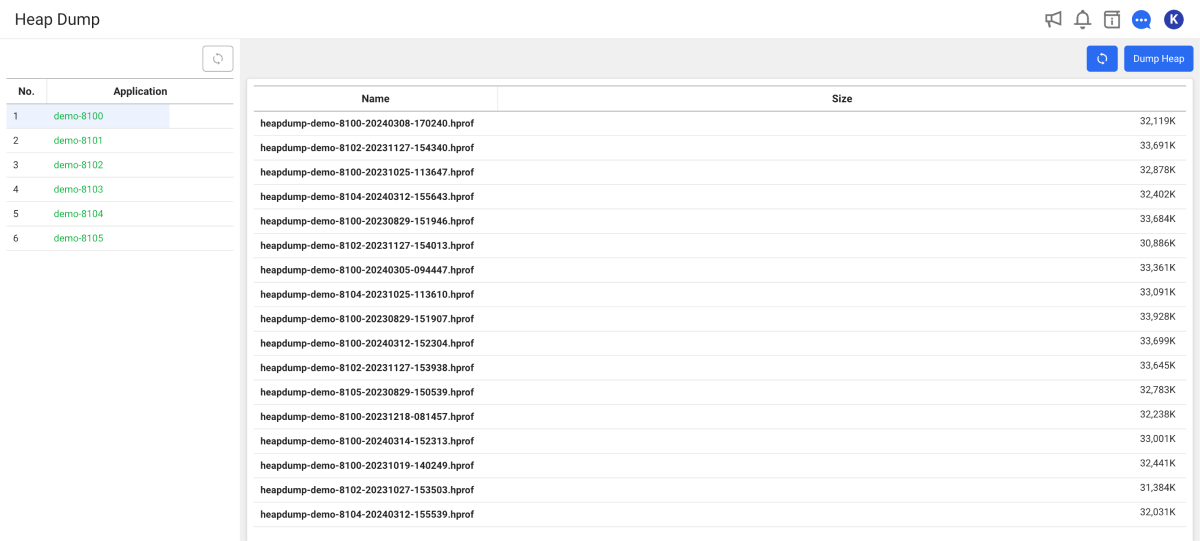
If any problem occurs such as a memory leak while running the Java application, you can generate its dump file for analysis of the problem. Select Dump Heap. The generated dump file is stored on the application server. You can see it in the dump directory under the path where you installed the agent.
This function is supported in Java agent 1.5.2 or later. Set the heapdump_enabled option to true in the agent configuration. Select Dump Heap to enable the function to create a heap dump file. It does not automatically generate a heap dump each time, and this option does not affect the performance. However, dump acquisition may affect the performance.
Obtaining a heap dump requires a significant burden. Separate from the burden, because the execution of the application code is stopped (stop the world) until all heap dumps are extracted, the perceived performance difference by the user may be more severe.
Throttling CONF.
Home > Select Project > Instance Performance Management > Throttling CONF.
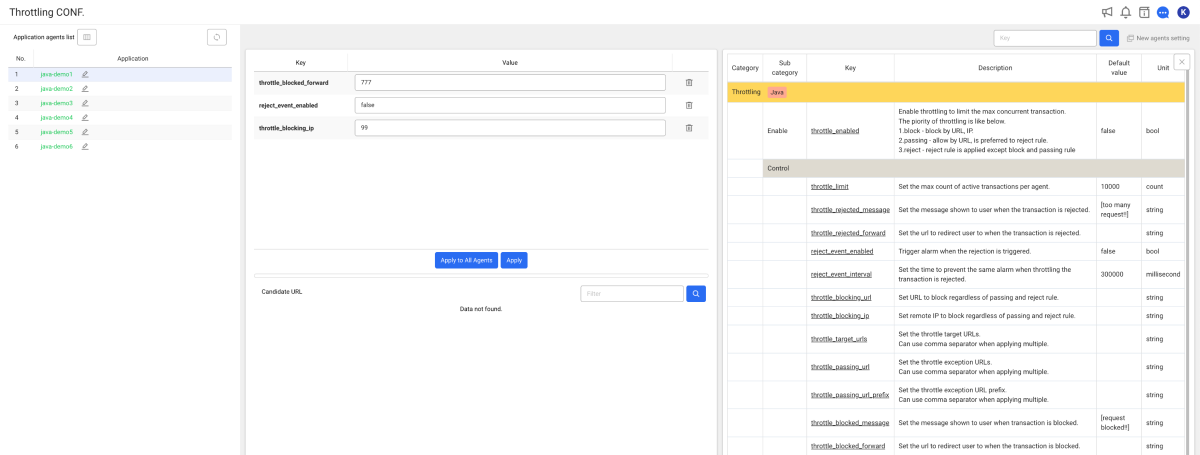
You can see the agent settings for load control of Java applications, and then set the related options. For more information about the agent settings for load control, see the following.
Agent CONF. Old
Home > Select Project > Instance Performance Management > Agent CONF. Old
You can add, modify, or delete the agent configuration options without directly modifying the whatap.conf file located on the monitored server. When you click Download Config File, the whatap.conf file of the selected agent is downloaded.
For the agent configuration, it is recommended to use the Management > Agent CONF. menu that has improved the usability and functionality. On the upper right of the screen, select New agents setting. For more information, see the following.