Active Transaction Dashboard
Home > Select Project > Dashboard > Active Transaction
You can quickly recognize abnormal transactions by using URLs, SQLs, and HTTP calls of the active transactions, and can analyze the delayed sections in detail through the transaction trace details.
By adding a database project via the Correlated Project Management menu, you can view the SQL performance of the database linked to the current transaction. For more information about the Correlated Project Management menu and linked project analysis, see the following.
Screen layout
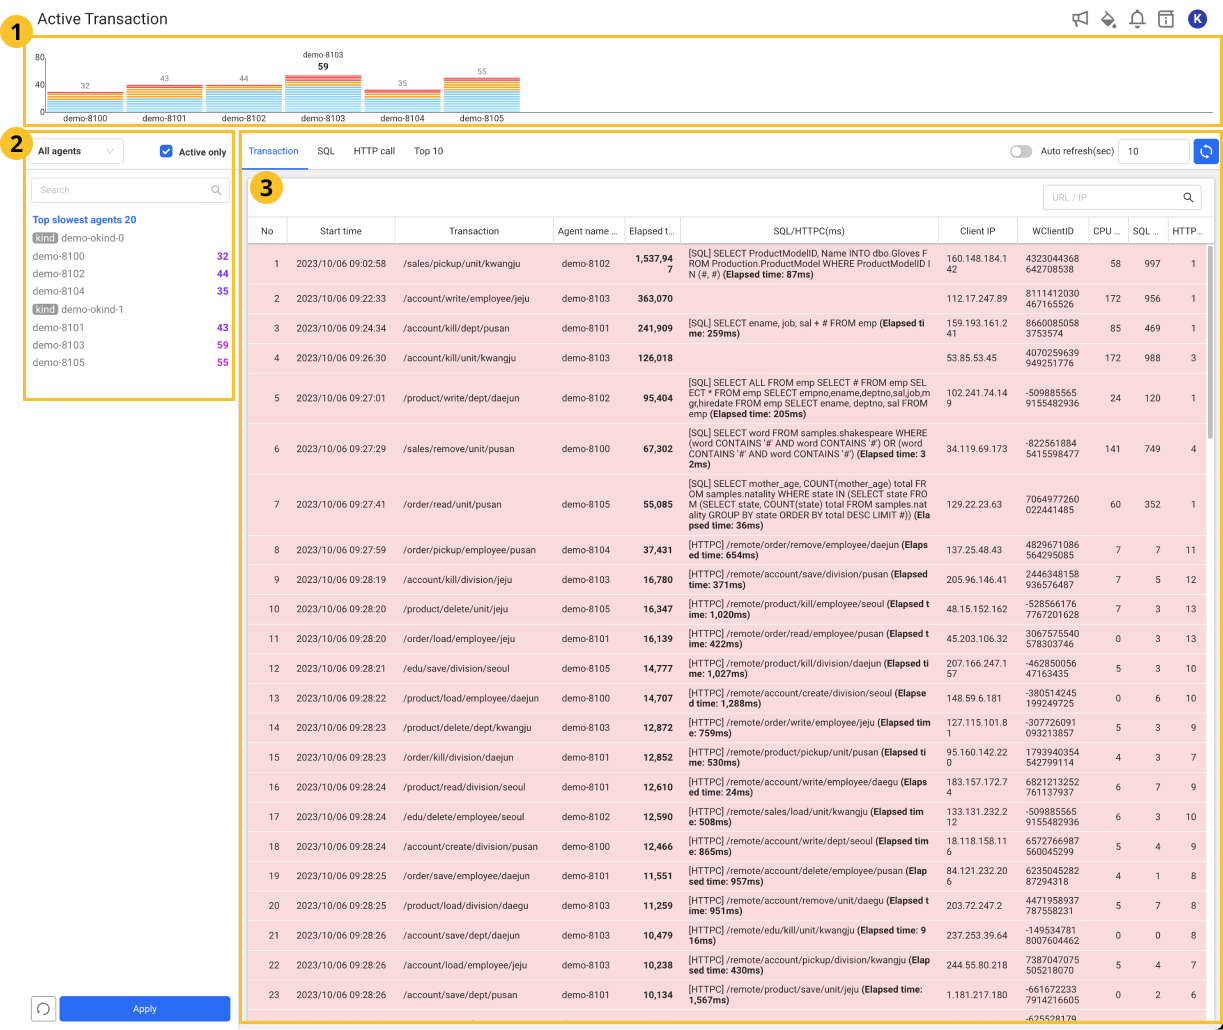
 Active transactions for each agent
It displays a list of all application servers and the total number of active transactions. Hover your mouse over each graph on the chart to display the transaction speed. The speed of the transaction state is classified into Normal, Slow, and Very Slow.
 Agent List
It displays the application server list and the total number of active transactions. If you select the application server, In the  transaction list, the detailed information appears.
Transaction List
It displays the detailed information of active transactions including URLs, SQLs, and HTTP calls. If you select the Top 10 Items tab, you can see a table of items sorted by the elapsed time in the ascending order. Likewise, the speeds of the transaction state are classified into Normal, Slow, and Very Slow.
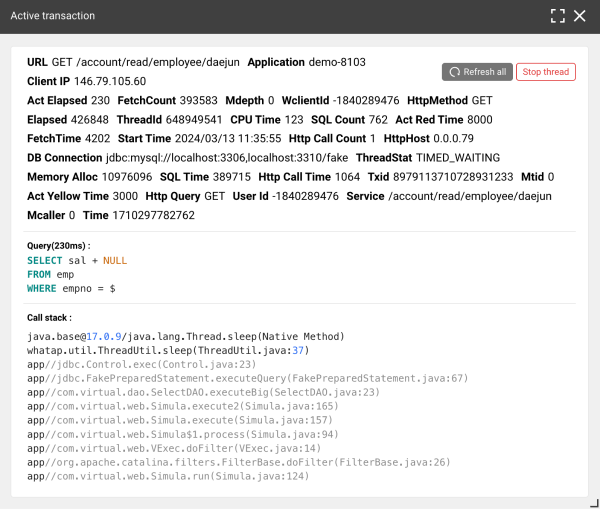
When you select an item in the transaction list, the Active transaction window appears where you can see the details on the selected transaction.
-
You can see detailed information of the running transactions, external calls, queries, call stacks, and the like.
-
Refresh all: You can update information of the running transactions.
-
Stop thread: You can stop a transaction in progress. To stop threading, Secret key is required. For more information about Secret key, see the following.
-
Correlated DB session: You can query the SQL performance of the database linked to the active transaction. It appears only when the selected transaction is the one that executed SQL as a linked project. For more information about addition and management of the linked projects, see the following.
TipStop thread forcibly stops threads running in the application. However, this feature may not work in all cases. For example, if a thread performs an IO operation, the thread cannot be stopped immediately.
Stop thread attempts to terminate the thread even if it is performing an IO operation. However, the thread does not stop until it finishes its IO operation. The thread accepts the termination request, but it does not stop until its operation is completed and it goes to the next work.
In this case, forcible termination is not recommended because it may cause problems with business logic and cause unexpected operations. If you need to stop the thread, stop and restart the entire application.
-
-
If a transaction has already ended, the Show trace button appears. When you select the button, the Transaction information window appears. For more information about Transaction information, see the following.
Agent list filtering
In Agent List, you can select or search the filtering targets and see them individually in the transaction list.
-
To see the active agents, select the Active only checkbox.
-
Click the All agents list box. You can view the agents by category.
-
To see active transactions by agent, select an agent and then click Apply. To cancel the selection, select
 .
Automatic refresh
The active transactions can be automatically updated at the set intervals. Select Auto refresh(sec) to activate the option, and then enter the refresh interval in the field on the right.
To deactivate the auto refresh setting, select Auto refresh(sec) again.
- The time is updated in seconds.
- To update the transaction list when the auto refresh is deactivated, select
 .
Transaction list filtering
In Transaction List, you can search for URL or IP for filtering. Enter a filtering target in the URL/IP field on the upper right and then press Enter or select  . It filters with the transaction list that includes the input text.
To initialize the filtered list, delete text in the URL/IP field on the upper right, and then press Enter or select .
Active Call Topology
When a very slow transaction is waiting for a response after calling another service, you need to find which segment of the call chain is taking time. Active Call Topology draws the running transactions linked by the same multi-transaction ID (mtid) in call order. During an incident, you can find the service where the delay started and the node where an error occurred without waiting for the transaction to finish.
Active Call Topology is available only in Java projects, with Java agent 2.2.83 or later. Hover over the information icon in the Topology column header of the transaction list to check the supported agent version.
Opening the topology
You can open Active Call Topology in either of the following ways.
- In the Topology column of the transaction list, click the View Topology button.
- Select an item in the transaction list to open the Active Transaction window, and then click the View Topology button.
The View Topology button appears only for transactions that have an mtid and are shown in red in the list because their elapsed time exceeds the Very Slow threshold.
Screen layout
The top of the topology window shows the transaction name and mtid. The option bar below shows the query time, the number of running and finished nodes, the number of displayed and total nodes, and the level legend.
- A node represents one transaction. Each node shows its elapsed time level as
Normal,Slow, orVery Slowbased on the thresholds of its agent. Nodes without threshold information are shown in gray with no level. - Nodes with recorded errors also show the exception class and message. Because the transaction is still running, more errors may be recorded.
- SQL and HTTP calls that a node is executing are shown as separate external call and DB nodes.
- Calls to another project are shown with a dashed edge and a project code label.
- If the same caller calls many transactions of the same service, only some are shown as nodes and the rest are grouped into a summary node.
- If some agents do not respond or the query limit is reached, the option bar shows the Partial data status. Hover over it to check the reason for each agent (no response, connection failure, project storage query failure, and so on).
Node details
Click a node to open the node details window.
- For a running node, the upper part shows the summary and call stack, and the lower part shows the steps recorded so far. Steps are divided into the Trace, Active Stack, Method/SQL/HTTP call summary, and Transaction Log tabs.
- Click the Refresh Call Stack button to fetch the node's current call stack again.
- Click the Stop Thread button to stop the node's transaction. Stopping a thread requires the Secret Key.
- For a node that has already finished, transaction information is shown.
- Nodes that did not respond and summary nodes show a guidance message instead of details.
For more information about active transaction settings, see the following.