HITMAP
What is Transaction Tracing?
While the transaction performance means the summary metrics or attributes between the start and end of transaction, the transaction profile traces the steps during transactions. If any transaction is slow or erroneous, the execution records must be traced step by step to find the cause. This is called transaction tracing.
The types of steps collected for transaction performance tracing are as follows.
-
DB connection step START-END
It includes the performance for connection to RDB. Step information includes the name, response time, and error.
TipIf you add a database project through the Correlated Project Management menu, you can see the performance metrics of the linked project. For more detailed information about adding and analyzing a linked project, see [the following] (linked-projects).
-
SQL Step START-END
It includes the performance for JDBC SQL. Step information includes connection data, SQL statements, and errors.
-
HTTP Call step START-END
It includes the performance for the outbound HTTP service call. Step information includes URL, host, port, response time, and errors.
-
Message step ADD
While collecting traces, the message steps are used to collect the records of all irregular sections.
-
SOCKET Step ADD
Step to represent the socket open.
-
METHOD Step START-END
The method response time is traced.
-
ACTIVE STACK Step START-END
It includes the active stack information. It is created and collected by a separate thread and it is added to the transaction trace.
In the WhaTap monitoring service, Step is used as the same meaning as Span.
Detailed analysis
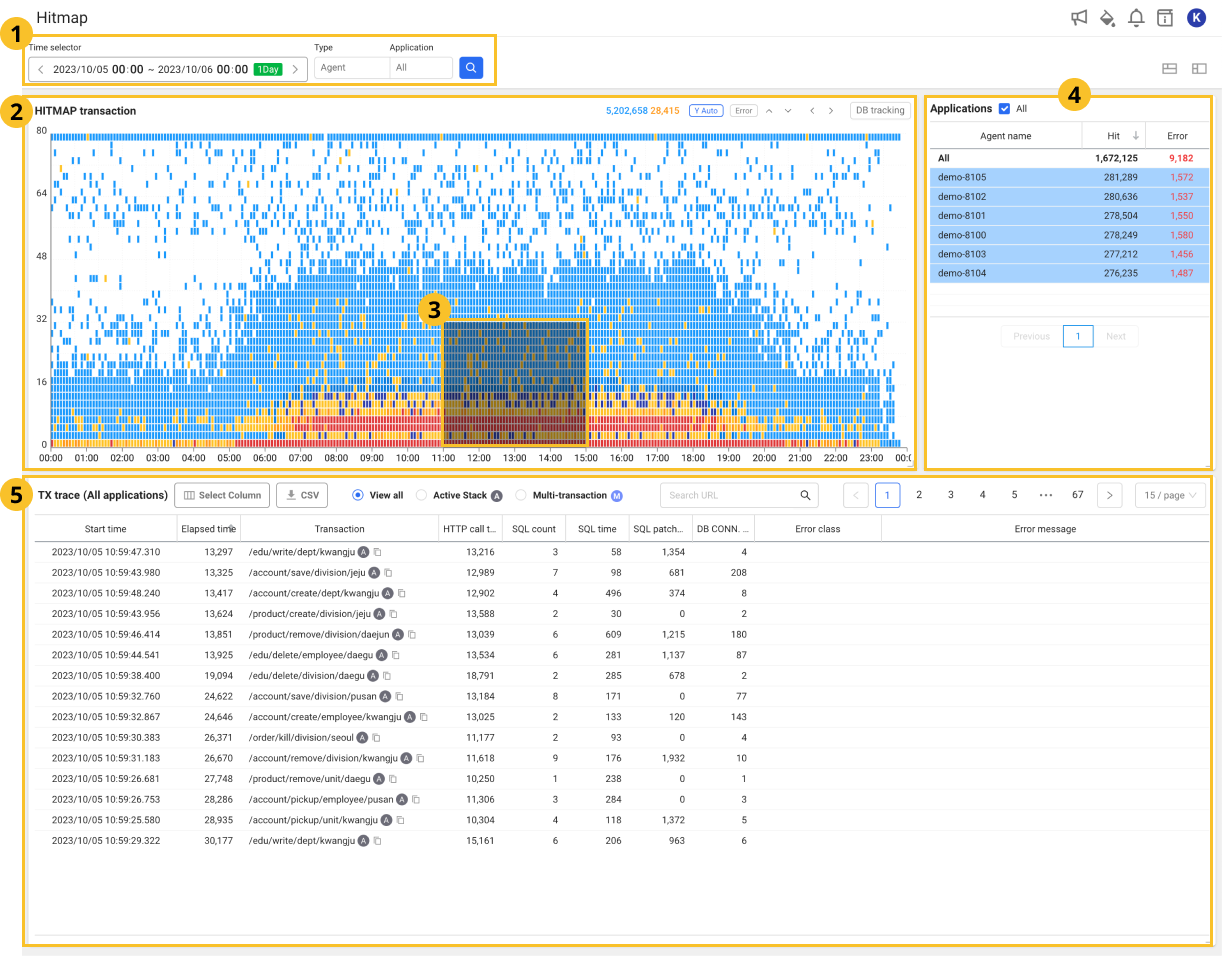
Home > Select Project > Analysis > Hitmap
-
In
 Time selector, select a time period to see the hitmap.
 -
In
Type and Application, select the targets to view. -
Select
 .
. -
In
 HITMAP transaction, drag a desired area as in
  .
. -
If the list appears in
 TX trace, select a transaction to analyze.
The Transaction information window appears where you can check properties such as client information for transaction performance analysis, transaction processing performance, and detailed execution history for each section.
-
For more information about the Hitmap menu, see the following.
-
For more information about the hitmap widgets on the application dashboard, see the following.
Guide to transaction information window

-
In the
area, the step data can be seen in various formats. Select a desired type of tab. -
In the
area, you can see the basic information for transactions. -
 : The statistical data window for the corresponding URL or each execution section appears. Click a desired time on the graph chart in the statistical data window to go to Statistics or Transaction Search. You can view the statistical data based on the selected time.Note
-
For more information about Statistics, see the following.
-
For more information about the Transaction Search menu, see the following.
-
-
If you select
 SQL step, the SQL variables and HTTP queries can be viewed. For more information, see the following.
Table view
In the Table view tab, you can see the transaction execution steps in chronological order.
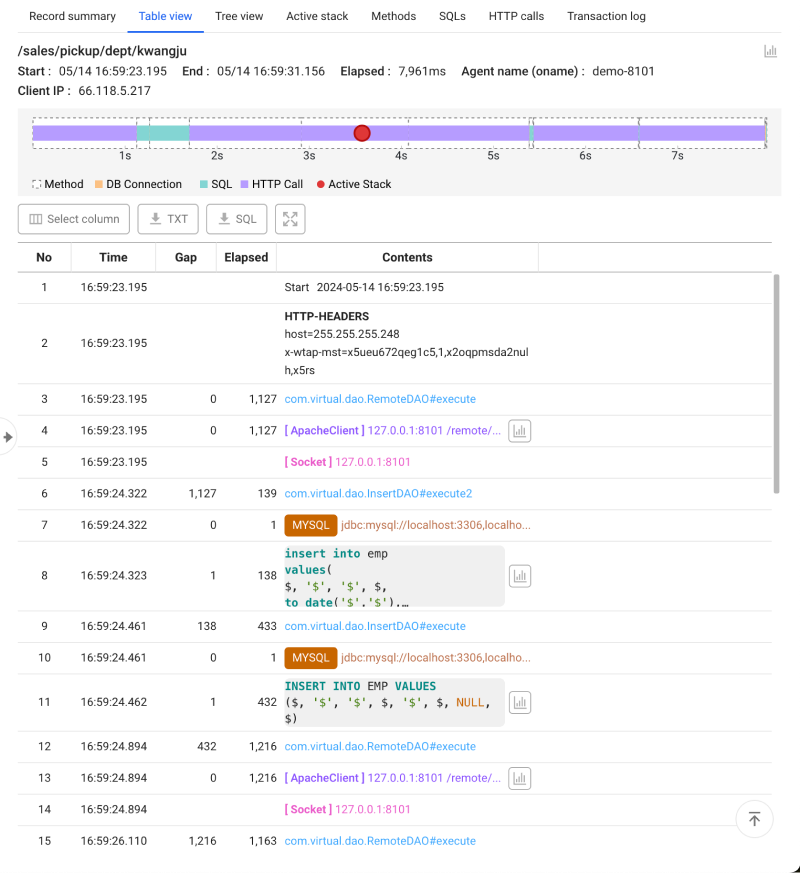
- You can classify transactions by each execution section and see them in a diagram. Out of all elapsed times, you can quickly find the times spent for each section and the section that took the longest.
-
If you select each section in the diagram, the corresponding table list appears where the step is located.
-
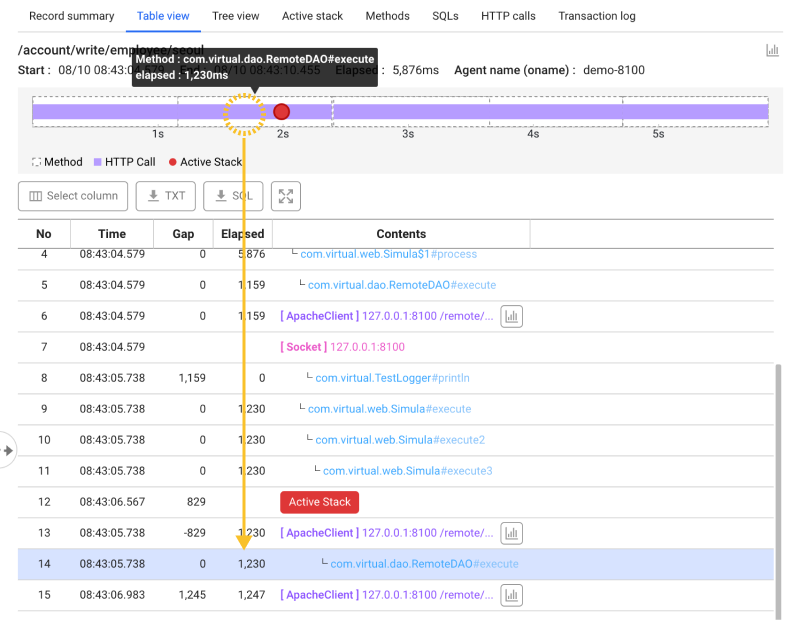
The area where the red circle (
 ) is located, is the moment when the active stack has been collected. If you select the red circle, the table list appears where the Active Stack button is located. If you click Active Stack, you can check the step performed during the section.Note
-
In the transaction list, you can see them from the items marked with the
 icon.
icon. -
For more information about active stacks, see the following.
-
-
 Select column: You can add or hide the memory accumulation and CPU accumulation data as columns in the table list. The columns are as follows:
-
No: Step occurrence sequence
-
Time: Start time of each step
-
Gap: The waited time between the start time of the previous step and the current step may have a difference, while there may be a gap from the elapsed time if a delay happens due to external factors.
-
Elapsed: Total elapsed time from the start to the end of each method
-
Contents: Execution details of the step
-
-
 TXT: You can download basic transaction data and execution data for each section in a text file.
 -
SQL: The basic transaction information and SQL execution data can be downloaded as a text file.
-
Download with substitute value: It downloads the SQL statistics data after replacing the bind variable value with its original one. If a security key (
paramkey) is set, the security key input window appears. You must enter the security key for downloading. For more information about the agent configuration related to the security key, see the following. -
Download without substitute value: It downloads SQL statistics data without replacing the bind variable value.
-
-
 : You can see only the table list, with hiding the transaction summary and diagrams. If you select
  , the hidden information reappears. This feature is useful when you have a long list of tables.
 -
If you select the SQL step, the SQL window appears to display parameters. For more information, see the following.
If you add a database project through the Correlated Project Management menu, you can see the performance metrics of the project linked in the DB connection step.
For more detailed information about adding and analyzing a linked project, see [the following] (linked-projects).
Record summary
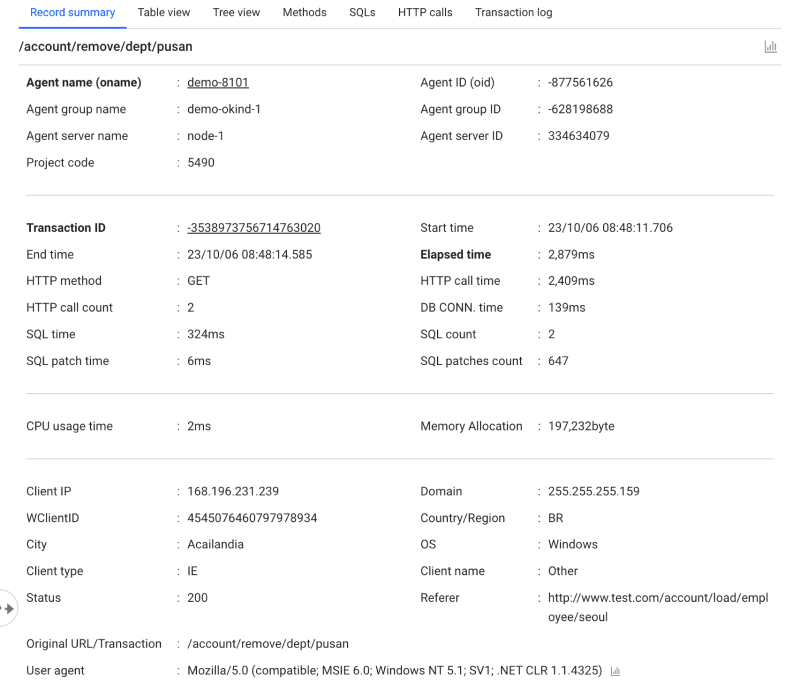
To see the basic information for transactions, select the Record summary tab. You can see the basic information of the transaction, agent on which the transaction was performed, memory allocation usage, and client information.
Transaction properties
| Classification | Properties | Description |
|---|---|---|
| Transaction | Transaction | API or URL call executed by the application, and the path of the transaction. It converts to a specific format using regular expressions. |
| Original URL | It is the URL path that was actually called. A concrete request path that does not include variables. If there is an original URL, the original URL appears. If there is no original URL, it is not displayed. | |
| Project code | Identification code of the project registered in the WhaTap monitoring service. | |
| Status | HTTP response status code for the transaction. | |
| Error level | Level of the error that occurred in the transaction. It is displayed as Warning or Critical. | |
| Error class | Class of the error that occurred in the transaction. | |
| Error message | Message of the error that occurred in the transaction. | |
| Elapsed time | Transaction execution time. | |
| Start time | Transaction start time. | |
| End time | Transaction end time. | |
| User agent | Browser used to extract client-related data. | |
| Referer | Page address or incoming path used by the browser of the client. | |
| Transaction ID | It is a unique ID of the transaction. | |
| Multi transaction ID | It is a unique ID of the multi-transaction. It appears when executed in parallel with transactions of other applications. | |
| Agent | Agent name (oname) | Agent name |
| Agent ID (oid) | It is a unique ID of the agent. | |
| Agent group name | Agent group name set with the okind option. | |
| Agent group ID | It is a unique ID of the agent group. | |
| Agent server name | Agent server name set with the ondoe option. | |
| Agent server ID | It is a unique ID of the agent server. | |
| Step | HTTP method | HTTP method. (GET, POST, PUT, HEAD, etc.) |
| HTTP call time | Outbound HTTP call time. | |
| HTTP call count | Number of outbound HTTP calls. | |
| DB CONN. time | Time taken to connect to the database. | |
| SQL time | SQL execution time. | |
| SQL count | SQL execution count. | |
| SQL patch time | Time taken to search for the record. Nesting may occur or other logic may be included. | |
| SQL fetch count | Number of the records retrieved from SQL. | |
| Resource | CPU usage time | CPU time used for processing transactions. |
| Memory allocation | Amount of memory used by the transaction. | |
| Containers | Pod name | It is the name of the Kubernetes Pod that processed the transaction. |
| Container Id | It is a unique identifier for a specific container running within a Pod. | |
| Client | Client IP | Client IP address. |
| OS | OS environment in which the browser runs. | |
| Domain | Internet address assigned to the IP address that the client connected to. | |
| Country/Region | Client's country. | |
| City | City in the client's country. | |
| Client type | Browser type used by the client. | |
| Client name | Device name used by the client. | |
| WClientID | This is a unique ID of the client. | |
| Method | methodCount | Number of methods called by transactions. |
| methodTime | Time taken for method execution. |
-
The collected data may differ depending on the application type, settings, and step type. Container entries appear only when the application is running in the container environment.
-
Error related items are displayed when an error occurs from the transaction.
-
Some transaction properties provide statistical features. If you select the
button, a window appears where you can see the status of transactions occurred during the query time through a time series chart. If you select a bar graph in the chart, you can go to the Analysis > Transaction Search menu to view details. -
WhaTap basically stores the client-related information. For more information about the agent settings for user data collection, see the following.
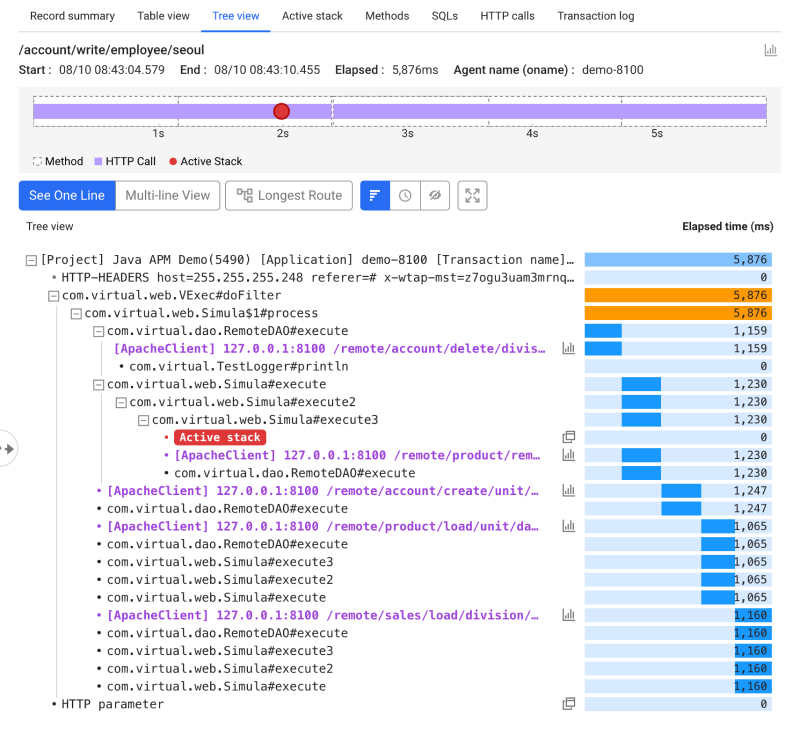
Tree view
To see the transaction execution steps in a tree format, select the Tree view tab. You can see the details of each transaction and its trace details, trace start time, step time, and call relationship. If you select each section of the diagram, the tree view of the step appears.
-
Single-line View: You can arrange the tree format at intervals by displaying the texts displayed in the execution data for each section in a single line.
-
Multi-line View: All the texts displayed in the execution data for each section, appear by wrapping words.
-
Longest Path: The longest route can appear.
-
 Show Time Bar: The elapsed times are displayed in a bar chart.
 -
 Show Time: The timestamps, gaps, and elapsed times for each segment are displayed in text.
-
8 seconds or more: Excessive delay state is distinguished in red.
-
Between 3 and 8 seconds: Delay state is distinguished in orange.
-
Less than 3 seconds: Normal state is distinguished in blue.
-
-
 Hide Time: The time is hidden.
 -
: You can see only the tree view that hides transaction summary and diagrams. If you select , the hidden information reappears. This feature is useful when the tree view list is long.
-
 : A window appears where you can view SQL variables and HTTP queries. For more information, see the following.
In case of start and step times, the time differences caused by the transaction call environment are corrected on the screen through traces and mappings in the parent transactions. Accordingly, there may be differences from the actual time data.
Active stack
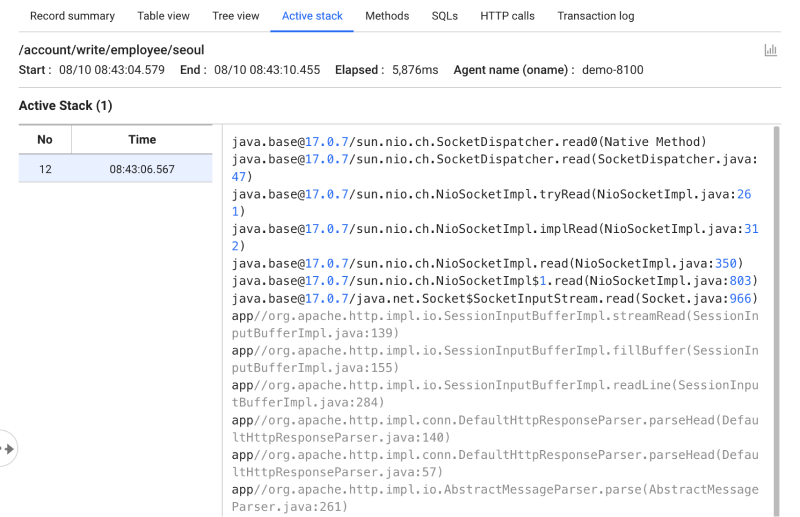
To check the zone and time that the active stacks have been collected, as well as related classes and methods, select the Active stack tab.
-
In the transaction list, you can see them from the items marked with the
icon. -
For more information about active stacks, see the following.
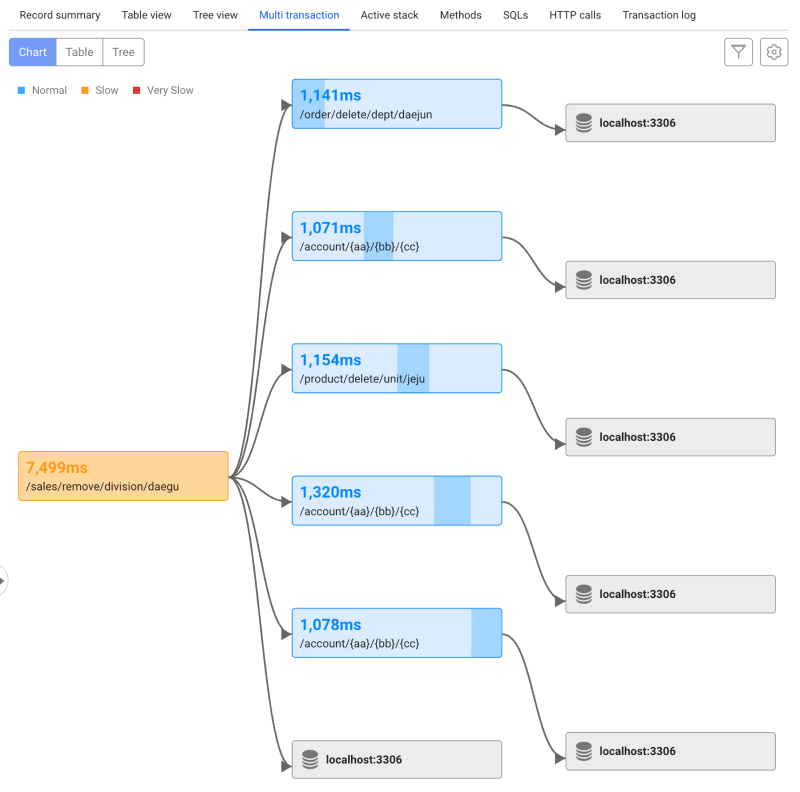
Multi-transaction
Multi-transaction indicates the transaction involving other agents or projects. In the Multi transaction tab, you can see the call relationships between applications registered in the WhaTap monitoring service.
To trace multi-transactions, set the mtrace_enabled option to true in Management > Agent CONF.. For more information about the agent configuration, see the following.
-
Chart: Provides the call relationships for each transaction in a flowchart. Select a transaction node to see the trace analysis for the transaction node. In Chart mode, you can use the mouse to go to a desired position or zoom in or out by scrolling.
 Chart view settings: You can display or hide the elements on the chart.
-
Table: In the form of table, you can check the data for each transaction included in the multi-transaction. You can select the
column selection icon to edit the table header columns. You can see the trace analysis data by selecting each transaction item. -
Tree: You can see the call relationships between transactions in a tree format. The related additional functions are the same as those of the Tree view tab.
-
 Project selection: You can select or deselect projects to be displayed on the chart.
-
You can see them in the transaction list marked with the
 icon.
icon. -
For more information about the multi-transaction, see the following.
Methods
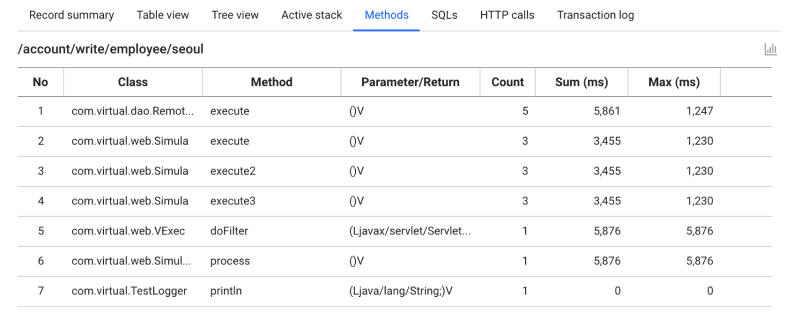
To see only the method data, select the Methods tab. It displays the method name and step time for which tracing has been set on the agent. When unnecessary logics are repeatedly executed, it can be used as analysis data to improve the method logic by finding the case where the execution takes longer than the low count.
For more information about the agent configuration options on methods, see the following. Method tracing support may differ depending on the product in use.
SQLs
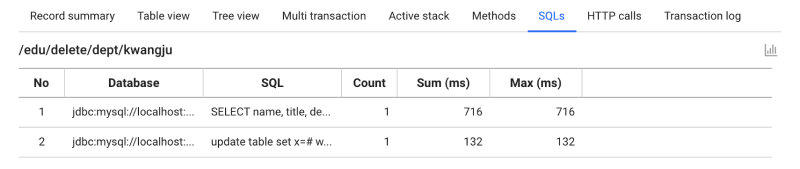
To check the SQL statement information, select the SQLs tab. In case of unnecessarily repetitive execution, it can be used as analytical data to improve query performance by finding the case where the execution time takes longer compared to the low count.
HTTP calls
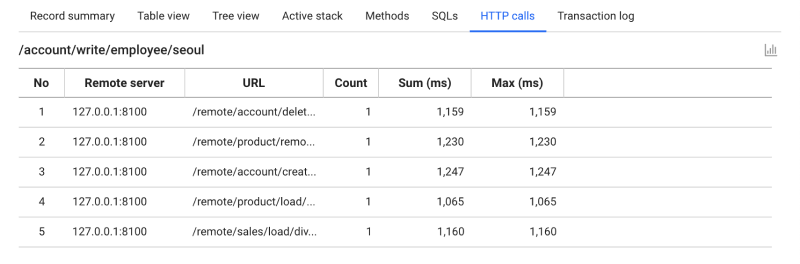
To see the count, time sum, average time, and such for HTTP calls, select the HTTP calls tab. If unnecessary external calls are repeatedly executed, it can be used as analytical information to determine whether the transaction delays are external or internal by finding the cases where the execution time takes longer compared to the low count.
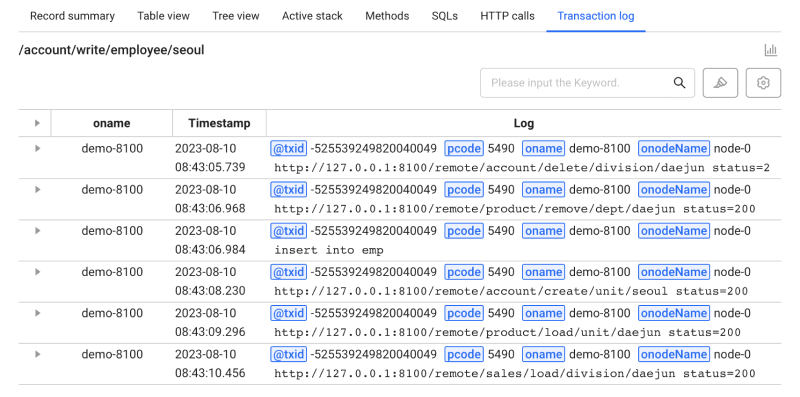
Transaction log
To see the logs of the transaction, select the Transaction log tab.
-
Keyword search: Enter the desired text to search in the keyword search field, and then press Enter or select the
 button. It highlights the keywords that match the entered text.
 -
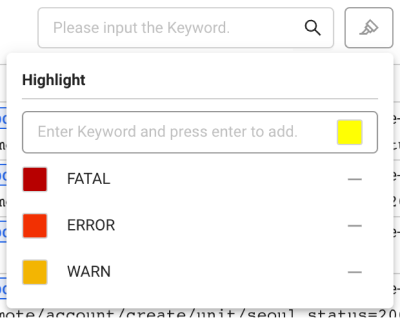
 Keyword highlight: If you set the keyword and color, the texts that match the keyword are automatically highlighted in the log list.
 -
Table settings: You can set the header columns in the log list table.
-
To enable the Transaction log tab, apply the agent setting options related to the logs. For more information about the log settings, see the following.
-
The Transaction log tab can be accessed by only the members with the View log role. For more information about the member roles, see the following.
Setting the keyword highlight
-
To add keywords to highlight, select
.
-
Enter a desired keyword.
-
Select the color icon and then select a desired color.
-
Press Enter.
The added keywords are added in the list.
Deleting the keyword highlight
To delete the items unused from the highlight list, select ![]() .
.
Additional options
Checking the correlated project metrics
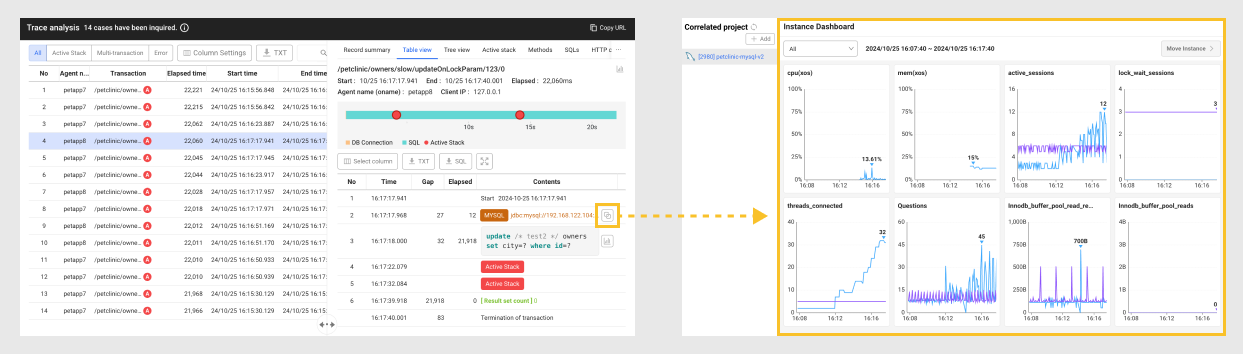
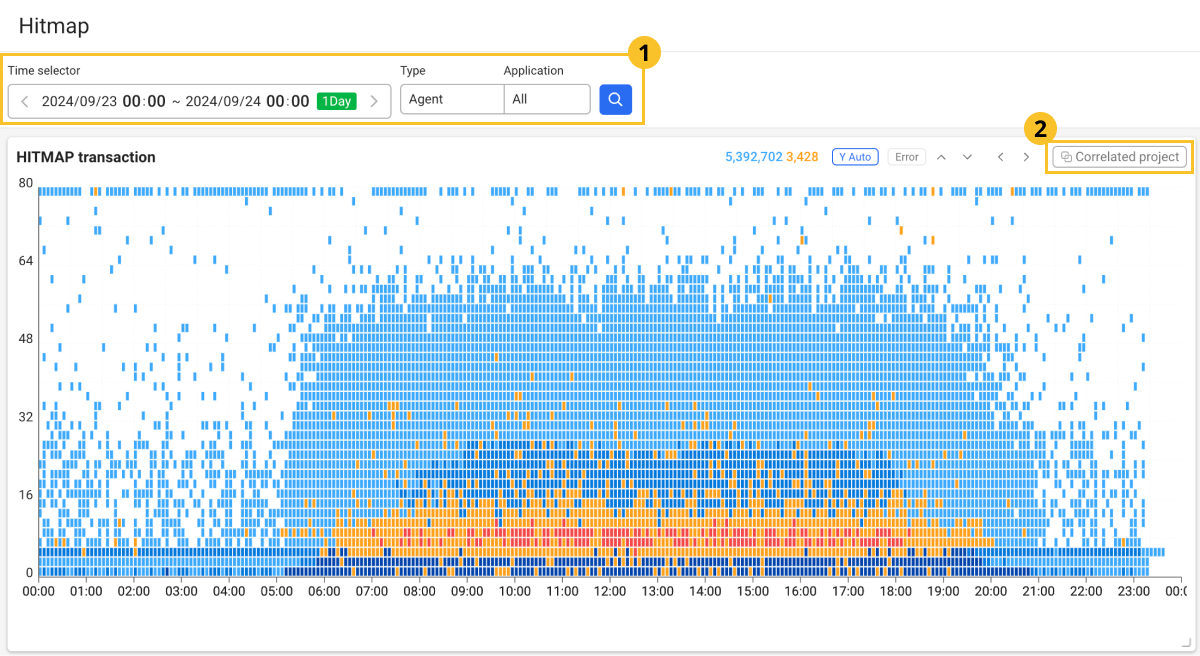
If you have created a database monitoring (DPM) project and an application monitoring (APM) project, you can relate the two projects for monitoring the data collected from DPM in the APM project. You can see performance metrics of the correlated projects while querying transactions via the Correlated project feature on the upper right of the HITMAP transaction section.
The Correlated project feature is useful when analyzing transactions in the APM project. When you found a slow SQL, it is difficult to determine exactly in which DB the problem occurred in the environment using multiple similar DBs.
-
Set the time and Application for viewing the transactions, and then select
. -
In the HITMAP transaction section, select Correlated project on the upper right.
-
A new window appears where you can check the metrics for the correlated project.
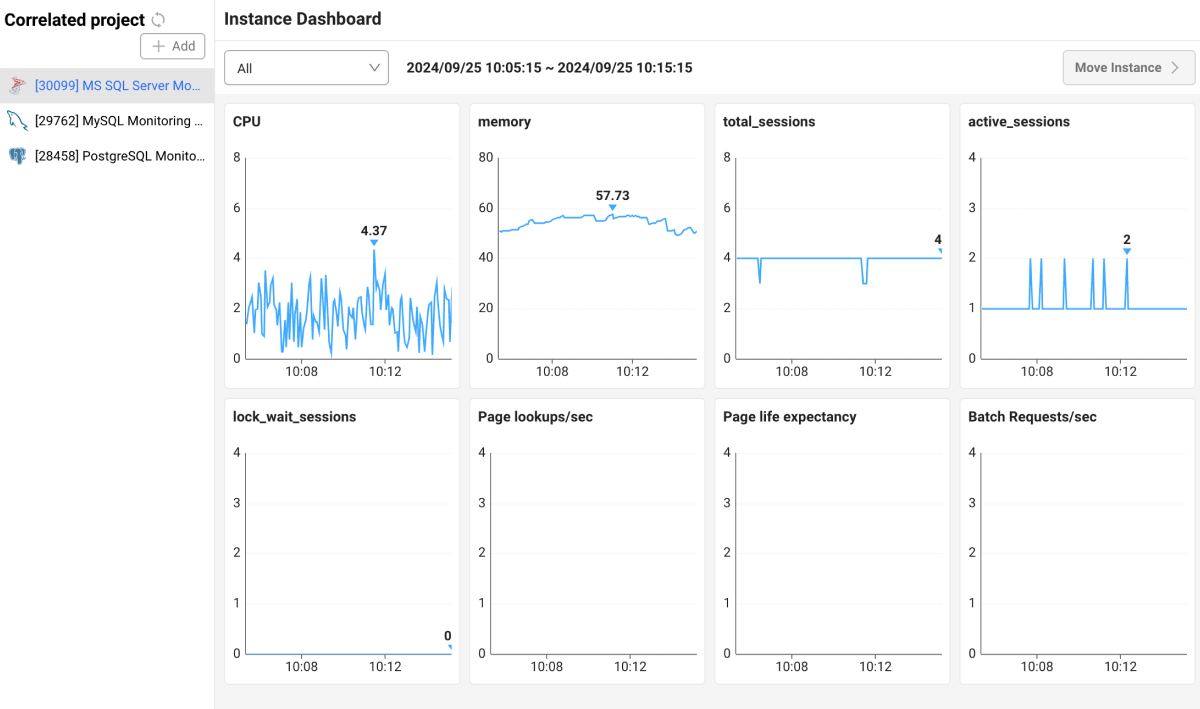
Select the correlated project from the left list and then check the metrics in the Instance Dashboard section.
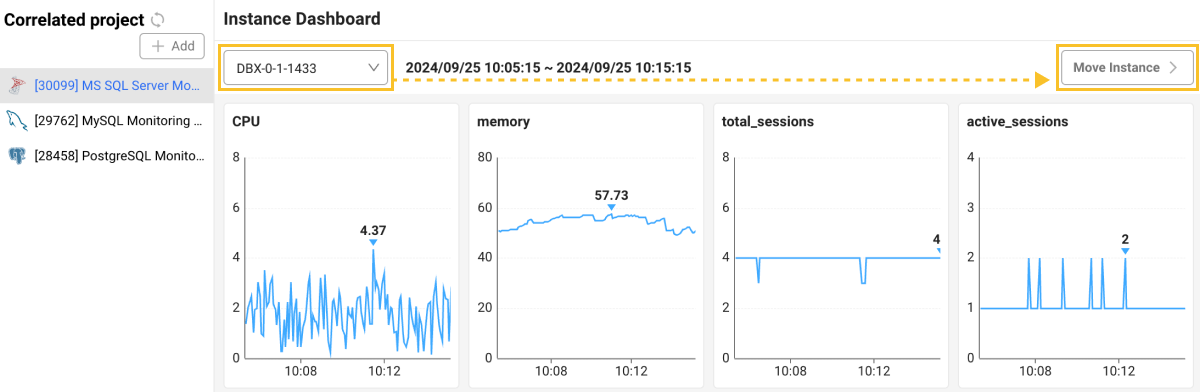
To navigate to the dashboard menu for a selected project, select an instance and then click Move Instance on the upper right. Go to Dashboard > Monitoring a Database Instance.
-
The HITMAP transaction button in the Correlated project section appears only when there is an associated project. For more information about adding a correlated project, see the following.
-
You can add a project by selecting Correlated project at the top of the left Add list.
-
The Move Instance button is disabled when All is selected.

-
Depending on the database product type, you can navigate to the Analysis > Counts Trend menu.
Viewing HTTP parameters
You can view the HTTP parameters of the transaction in the Table view tab.
-
Scroll down the page to the final step of the transaction.
-
Select the
 HTTP parameters item.
 -
If the HTTP-PARAMETERS window appears, select Password.
-
Enter the specified Param Key.
You can see the hidden parameters.
-
For the agent settings for HTTP parameters, see the following.
-
Password: You can see the decrypted parameter value. The password is a 6-digit string in the
WHATAP_HOME/security.conf (paramkey.txt) file. You can change it to another string. It is required to view the SQL variables and HTTP queries and to stop the threads. For more information, see the following.
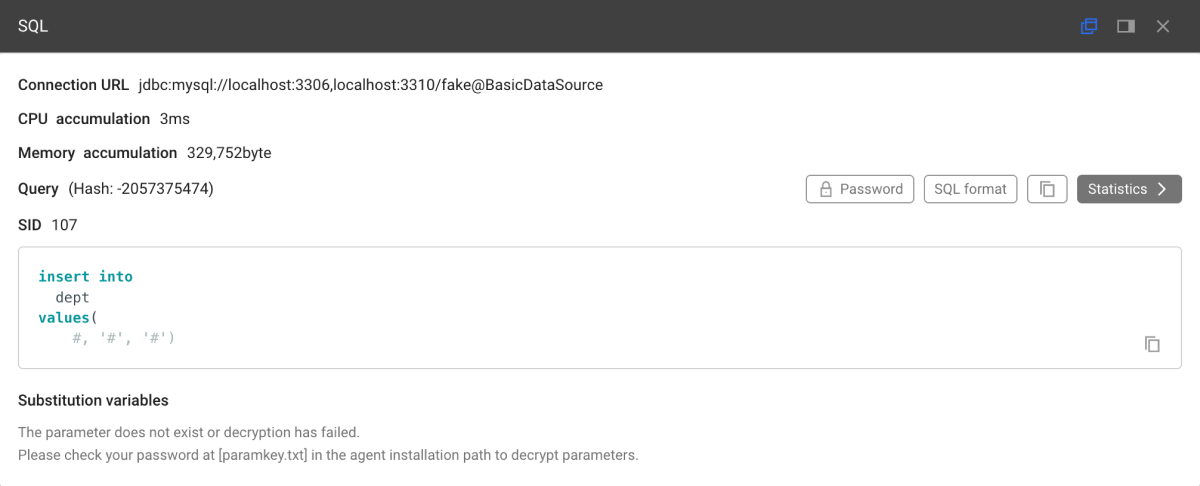
Viewing SQL parameters
Select the SQL step in the Table view tab or select ![]() in the Tree view tab. The SQL window appears to display parameters.
in the Tree view tab. The SQL window appears to display parameters.
-
Password: You can see the decrypted parameter value. The password is a 6-digit string(
paramkey) in theWHATAP_HOME/security.conf file. You can change it to another string.NotePassword is required to view the SQL variables and HTTP queries, and stop the threads. For more information, see the following.
-
SQL format: You can indent and format your SQL statements for better readability.
-
 : A SQL statement can be copied to the clipboard.
 -
Statistics: Go to Statistics > SQL.
To search SQL variables and HTTP queries, add the following options to the agent settings.
-
For agent settings related to recording SQL parameters, see the following.
-
For agent settings related to recording the HTTP parameters, see the following.
# SQL parameter lookup option: If the option is applied, SQL parameters are collected after being encrypted.
profile_sql_param_enabled=true

// HTTP parameter lookup option: If the option is applied, HTTP query parameters are collected after being encrypted.
profile_http_parameter_enabled=true
Setting the columns in the trace list
You can additionally see the details about the search result by setting the columns in the TX trace section. Select ![]() Select Column.
Select Column.
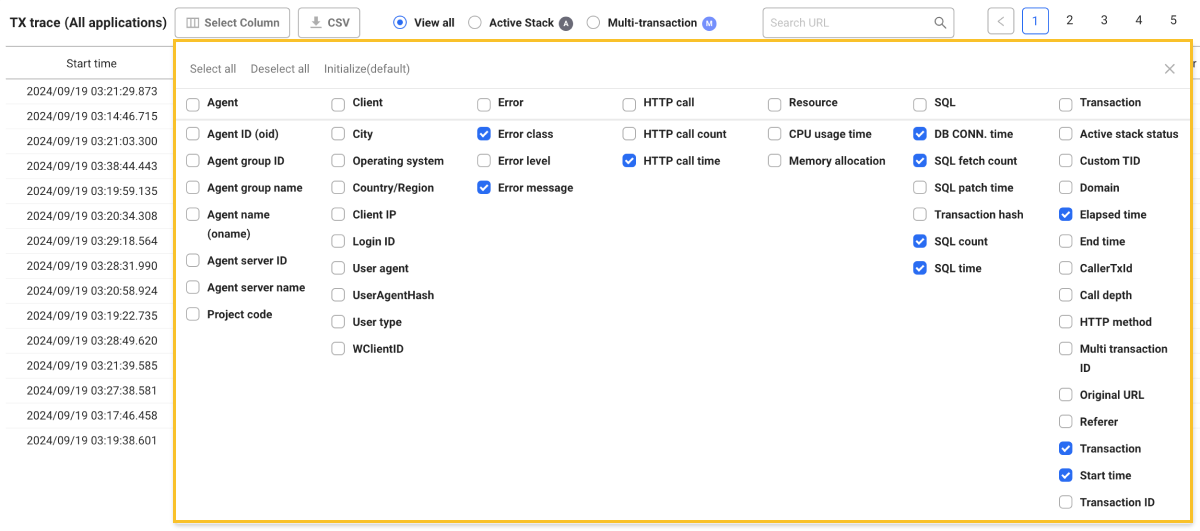
Select or unselect the desired columns. The settings are immediately applied in the table. Once you've completed all the settings, select ![]() on the upper right.
on the upper right.
-
Select all: It selects all columns.
-
Deselect all: All columns are unselected.
-
Initialize(default): The column is set as the default value.
Filtering the trace list
You can filter the results retrieved from the TX trace section using the following options:
![]()
-
View all: You can see all transactions in the viewed result.
-
Active Stack: Only the transactions that include active stacks can be viewed in the searched result.
-
Multi-transaction: Only the transactions including multi-transactions can be checked in the searched result.
-
Search URL: You can search for strings that match the transaction URL. Enter a desired string and then press
Enteron the keyboard.
Downloading the viewed list
You can download the results retrieved from the TX trace section as a CSV file.
-
After viewing the transactions, select
 .
. -
Enter a desired value in the Maximum CSV lines option.
-
Select Download.
The formation of the downloaded CSV file is profile{project_code}YYYYMMDD.csv.