NGINX monitoring
Feature Project
WhaTap newly introduced Feature Project (Features) so that users can easily check whether the desired software supports monitoring and easily start monitoring. The Feature Project provides an optimized monitoring solution by repackaging existing monitoring products to fit the software to monitor. Manage your services for stability and performance more effectively through the WhaTap's Feature Project.
NGINX is a high-performance HTTP and reverse proxy server that provides load balancing, caching, and HTTP cache features for web applications. NGINX is suitable for operating large-scale websites because it can effectively distribute and manage web traffic based on high concurrent processing performance.
WhaTap provides the NGINX monitoring with a new Feature Project method. It traces the overall performance and status of the NGINX server to help you find and resolve issues early as possible.
-
Metric Monitoring: It monitors various metrics of the NGINX server in real time, including request processing status, response codes, and connection status.
-
Dashboard: You can efficiently view and analyze the required metrics through the dashboard.
Operate and manage your NGINX server stably through WhaTap NGINX Monitoring.
Installation
The following guides you to the basic installation method for using the WhaTap NGINX monitoring service.
To use the WhaTap monitoring service, after Sign up, create a project and then install the agent to the target server. For more information about membership registration, see the following.
Supported environment
Before installing the WhaTap NGINX monitoring agent, check the support environment.
-
NGINX: NGINX 1.4.x or later
-
Ubuntu: Ubuntu 12.04 or later
-
OS: Red Hat 6 or equivalent (CentOS, Rocky Linux, Amazon Linux)
-
OS Architecture: Amd64/X86_64, Arm64/Aarch64
Creating a Feature Project
Create a feature project (Feature) before installing the agent.
-
Log in WhaTap monitoring service.
-
To create a project, on the left of the screen, select All Projects > + Project.
-
On the Select product screen, select the feature product to install in the project.
-
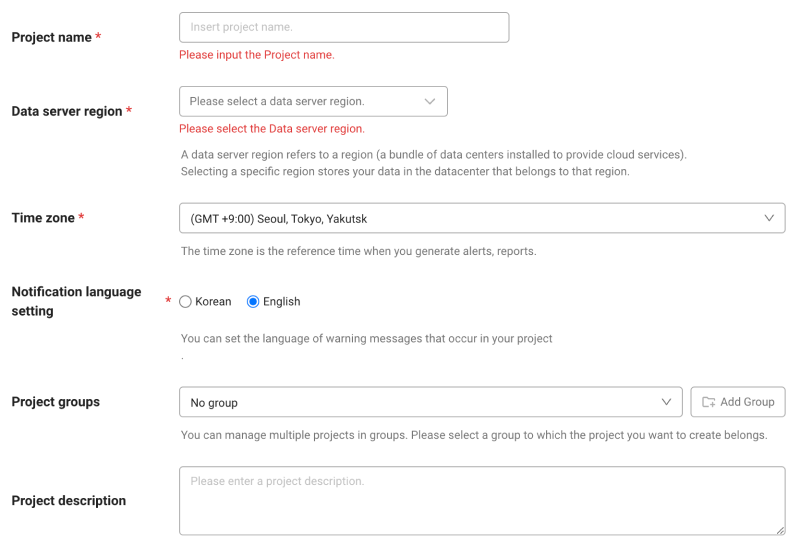
Configure the settings for Project name, Data server region, and Time zone.

-
In Notification language setting, select the language for alert messages.
-
After all settings are finished, select Creating a project.
NGINX agent installation
After creating a Feature Project (Features), the NGINX agent Installation screen appears. Proceed with installation according to the following instructions.
-
Check the project access key.
Project access key is the unique ID for activating the WhaTap services. Select
Getting the access key. -
Create the installation script.
Execute the following command to automatically check the user environment and create an installation script on the server where NGINX has been installed.
curl http://repo.whatap.io/telegraf/feature/nginx/install_nginx_monitoring.sh -o install_nginx_monitoring.shExecute the following command to install the NGINX agent.
chmod +x install_nginx_monitoring.sh
sudo ./install_nginx_monitoring.sh "x42ut20rmr8rn-z1kli3trqviqul-x5cm4quee6cdmj" "15.165.146.117"
Learn about the main features
Dashboard
Home > Select Feature Project (Feature) > NGINX > NGINX Dashboard
NGINX Dashboard provided by WhaTap is a visual tool that allows you to check the real-time performance of the web server at a glance, and effectively monitor traffic patterns, request processing status, and such. Analyze and manage the NGINX server performance with key metrics.
-
NGINX Requests Status Code
It monitors the status codes of requests processed by the NGINX server in real time. It classifies and checks the number of responses by status code such as 2XX, 3XX, 4XX, 5XX, 503 in real time.
Guide to dashboard metrics
-
Response2XX: It indicates a request that has been processed normally. It displays the number of requests successfully processed by the server in real time.
-
Response3XX: It traces redirected requests.
-
Response4XX: It displays a response for a client error, such as wrong request.
-
Response5XX: It traces the response status for a server error.
-
Response503: It traces the errors (unavailable service).
-
-
Nginx Metrics
It provides various metrics that comprehensively display the performance and status of NGINX. You can trace the connection status and processing details in real time.
Guide to dashboard metrics
-
NGINX Connections Accepted: It displays the number of connections allowed by the NGINX server.
-
NGINX Writing: It traces the numbers of connections that write responses to clients.
-
Active Connections(accepted): It displays the number of client connections handled by the NGINX server.
-
Waiting: It displays connections waiting in keep-alive status.
-
Handled Request: It displays the number of requests successfully handled by the NGIMX server.
-
NGINX Requests: It traces the total number of requests received by the NGIMX server in real time.
-
NGINX Reading: It displays the number of connections that are reading the request data from clients.
-
-
Domain Throughput
You can trace the traffic and performance at the domain level.
Guide to dashboard metrics
-
Response Bytes SUM: It displays the total bytes transmitted in the response. You can monitor the total traffic handled by the server.
-
Latency Average: It displays the average response delay time. It is an important metric to evaluate the response speed of the server.
-