Topology
What is Topology?
Through the real-time data collected from the monitored servers, you can easily understand the correlation between application servers.
Learn more about the topology from the following video clip:
A typical topology definition does not include the nodes that have no link data. From the monitoring point of view, the topology also requires the data of isolated nodes.
Basic elements of the topology
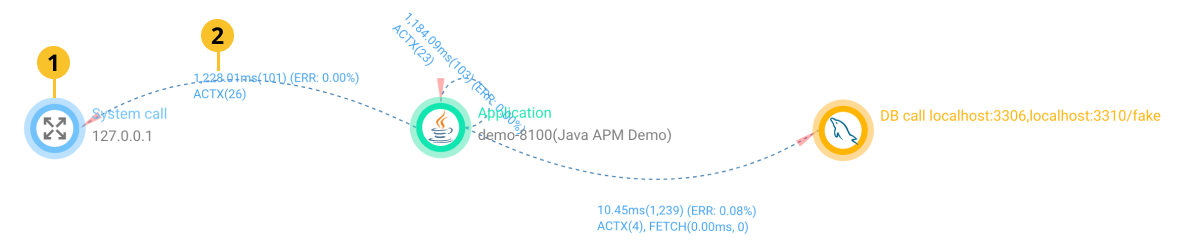
The data on the topology screen is divided into nodes, links, and additional information for each.
-
 Node
NodeIt represents the project, application group, application, database, external host to which HTTP calls, and external module (application caller).
NoteIf any call information exists from the node, the error weight is represented outside the node.
-
 Link
LinkIt represents call data between applications or application groups, database call data, external host call data, and call data from external modules.
-
Average Res. Time: Value of the sum of response times of transactions or calls between nodes for 5 seconds divided by the total number
-
Count: Total number of transactions or calls (including errors) between nodes for 5 seconds
-
Error: Total number of errors in transactions or calls between nodes for 5 seconds
-
Active TX: Number of transactions or calls in progress between nodes
-
Fetch Time: Total sum of record acquisition times in DB calls for 5 seconds
-
Fetch Count: Total sum of records acquired in DB calls for 5 seconds
-