IIS Perf. Count
Home > Select Project > Dashboard > IIS Perf. Count
By monitoring the key metrics in real time in Internet Information Services (IIS), you can optimize the server performance and improve the system stability by quickly detecting potential problems. You can also predict and take actions in advance against any impact caused by traffic increase or change in applications.
Performance monitoring
These are items used to evaluate the performance and stability of the web server. Each item traces the server's operation status and performance and helps you quickly find potential problems. The administrator can monitor these metrics and use them for reference to optimize the server performance and troubleshoot issues.
-
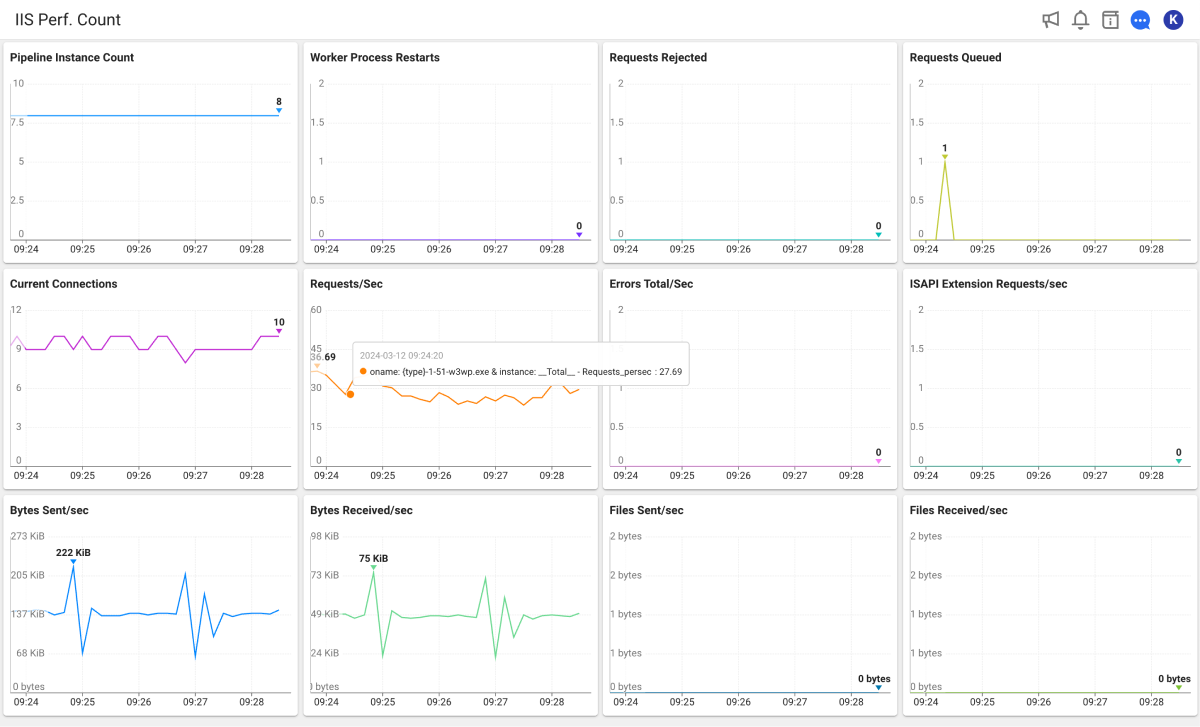
Pipeline Instance Count
Number of active pipeline instances. It indicates the number of HTTP requests being processed simultaneously. If this value increases, it indicates that the server got overloaded.
-
Worker Process Restarts
Number of restarted times because the worker process was terminated abnormally. If this metric value increases unexpectedly, investigate the problem as quickly as possible. It is used to evaluate the stability and reliability of applications.
-
Requests Rejected
Number of requests rejected by the server. It indicates the number of requests that return a 503 HTTP status code. This can be generated by too much server load or exceeding the set limits.
-
Requests Queued
Number of pending requests. It is the number of requests that the server cannot process. If the value is high, the server performance can be affected.
-
Current Connections
Number of active TCP connections. You can use it as a reference to check the server's load and trace the network resource usage.
-
Requests/Sec
Number of HTTP requests processed per second. It is the value measured for the application's throughput, which should remain constant within a specific range, excluding other server operations (garbage collection, cache cleanup threads, external server tools, etc.).
-
Errors Total/Sec
Number of errors that occurred while executing HTTP requests. It is the sum of compilation errors, preprocessing errors, and execution errors. You can see it to identify problems with the applications or servers.
-
ISAPI Extension Requests/sec
Number of ISAPI extension requests processed per second. Tasks such as user authentication, database access, and content filtering can all be performed through ISAPI extensions. Through this metric, you can have insight into how frequently the web server are processing dynamic tasks.
Tracing the network status and data transfer
These items are used to trace the server's network activities and data transfer volumes. These metrics help you evaluate the server's network performance and analyze traffic patterns. By monitoring the data transfer volumes and file transfer speeds, you can trace changes in network traffic and optimize the usage of resources.
-
Bytes Sent/sec
Bytes transferred per second. It can be used as a reference to trace the server's network activities and analyze traffic patterns.
-
Bytes Received/sec
Bytes received per second. It can be used as a reference to trace the amount of data transferred from clients to the server.
-
Files Sent/sec
Number of files transferred per second. You can reference it to trace the activities of file services and check the disk I/O usage.
-
Files Received/sec
Number of files received per second. It can be used as a reference to trace the file transfer activities from clients.