Stack
Home > Select Project > Analysis > Stack
You can check the call stack frequency and detailed information about methods and transactions in a specific time period. You can view Top stack, Unique stack, and Active stack. Top stack displays the usage of frequently called methods, while Unique stack analyzes the frequency of the same call stack. Active stack enables real-time performance analysis by regularly collecting stack information of active transactions.
The stack analysis is supported in the Java, Python, and .NET product platforms.
Guide to major features
The following major features are available. Stack viewing allows you to quickly identify and resolve performance issues in your application. By checking the frequency of a specific method call, call path, response time, and the like, you can devise measures to improve the performance.
-
Selecting a stack type
You can select a desired stack from Top stack, Unique stack, and Active stack for a view.
-
Top stack: Information of the stack with the most frequent calls is provided. For more information, see the following.
-
Unique stack: Statistical information about the cases where the set of executed methods is the same, is provided. For more information, see the following.
-
Active stack: The stack information of the running transaction is provided. For more information, see the following.
-
-
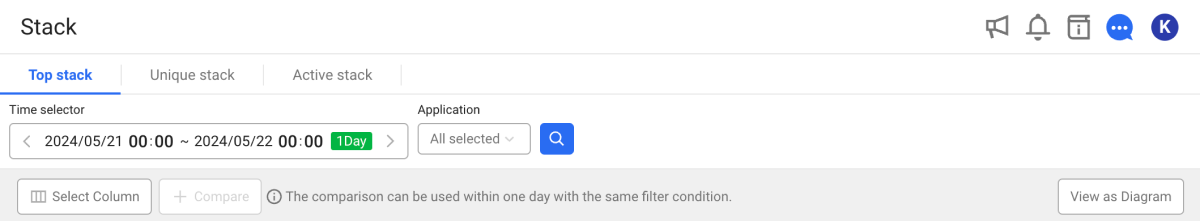
Time selector / Start date: Set the time to view. You can view the stacks for a specific time period or set a desired time period. Depending on the stack type, the lookup period may be restricted.
Note-
The maximum period to view Top stack and Unique stack is 3 days.
-
For more information on how to use the Time selector option, see the following.
-
-
Application: You can select an agent to view. You can select a specific agent. If nothing is selected, all agents in the project are viewed.
-
 Select Column: You can display or hide the desired columns.
 -
Compare: When searching within 1 day by the same filter conditions, you can compare the selected stacks over time. This allows you to see the changes in the call stack over time and see the performance trend. For more information, see the following.
-
 : When you expand a stack or transaction in the table list for each stack type, a snapshot icon appears on the utmost right. Selection of this icon allows you to save the stack or transaction information as an image file.
Basic usage guide
-
Select a desired stack type to view on the screen.
-
In Time selector or Start date, set the desired viewing time.
-
In Application, select an agent to view. If nothing is selected, all agents are viewed.
-
Select
 .
.
You can see the search results in the list of the stack table.
Top stack
Top stack provides information on the most frequently called methods. Through the call frequency of the method at the top of the stack, you can quickly find the method that has the most impact on the service. By checking the frequency of method calls, you can analyze the cause of the load on the CPU or memory. Through this, the measures to improve the performance can be derived.
WhaTap can use the thread stacks collected every 10 seconds (default value) to analyze the performance delay sections in the method level.
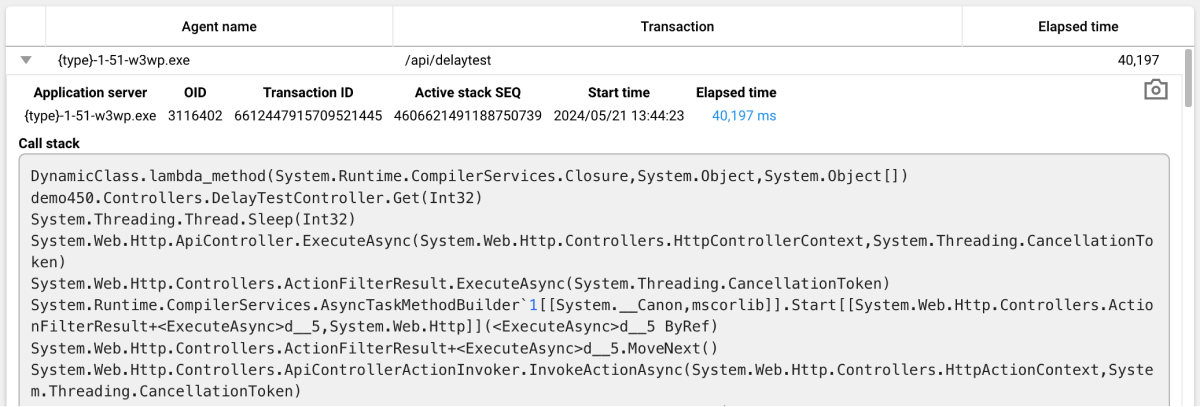
DynamicClass.lambda_method(System.Runtime.CompilerServices.Closure,System.Object,System.Object[])
demo450.Controllers.DelayTestController.Get(Int32)
System.Threading.Thread.Sleep(Int32)
System.Web.Http.ApiController.ExecuteAsync(System.Web.Http.Controllers.HttpControllerContext,System.Threading.CancellationToken)
System.Web.Http.Controllers.ActionFilterResult.ExecuteAsync(System.Threading.CancellationToken)
System.Runtime.CompilerServices.AsyncTaskMethodBuilder`1[[System.__Canon,mscorlib]].Start[[System.Web.Http.Controllers.ActionFilterResult+<ExecuteAsync>d__5,System.Web.Http]](<ExecuteAsync>d__5 ByRef)
System.Web.Http.Controllers.ActionFilterResult+<ExecuteAsync>d__5.MoveNext()
System.Web.Http.Controllers.ApiControllerActionInvoker.InvokeActionAsync(System.Web.Http.Controllers.HttpActionContext,System.Threading.CancellationToken)
System.Web.Http.Controllers.ApiControllerActionInvoker.InvokeActionAsyncCore(System.Web.Http.Controllers.HttpActionContext,System.Threading.CancellationToken)
...
In the example stack, the top line is lambda_method.
DynamicClass.lambda_method(System.Runtime.CompilerServices.Closure,System.Object,System.Object[])
Top line indicates that the thread to be dumped is executing that method. It may be caught momentarily, but it appears on the stack as a percentage of the sum of the module processing times. By calculating the frequency of this top line method, you can determine the method-level performance. WhaTap calls the top line frequency statistics as Top stack.
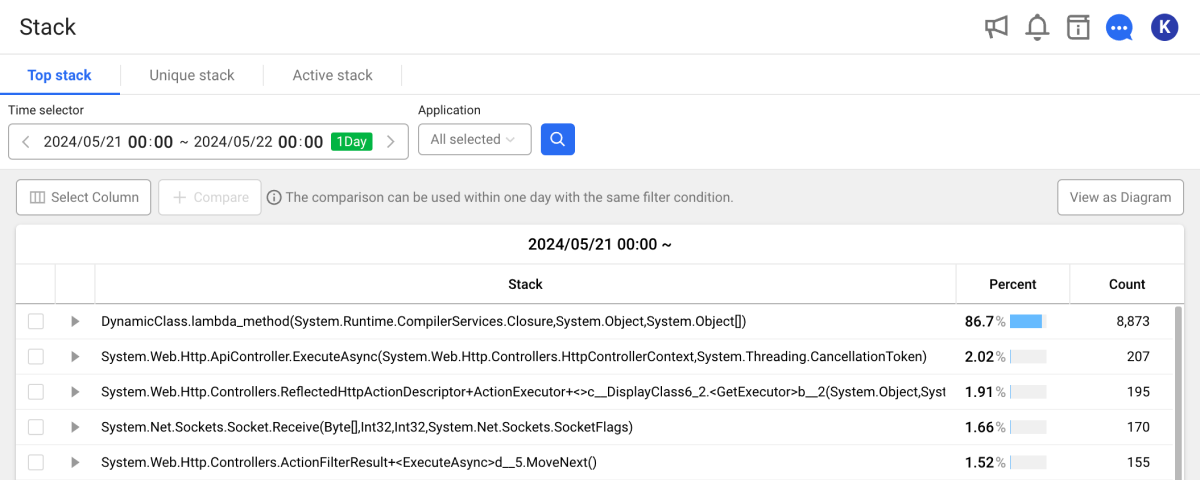
Through the Top stack analysis, you can analyze the frequencies of methods that were called. Based on each step on the stack trace, it provides the call rates between steps as percentage. The backlog frequency of the top step is calculated as percentage and the results are sorted in descending order.
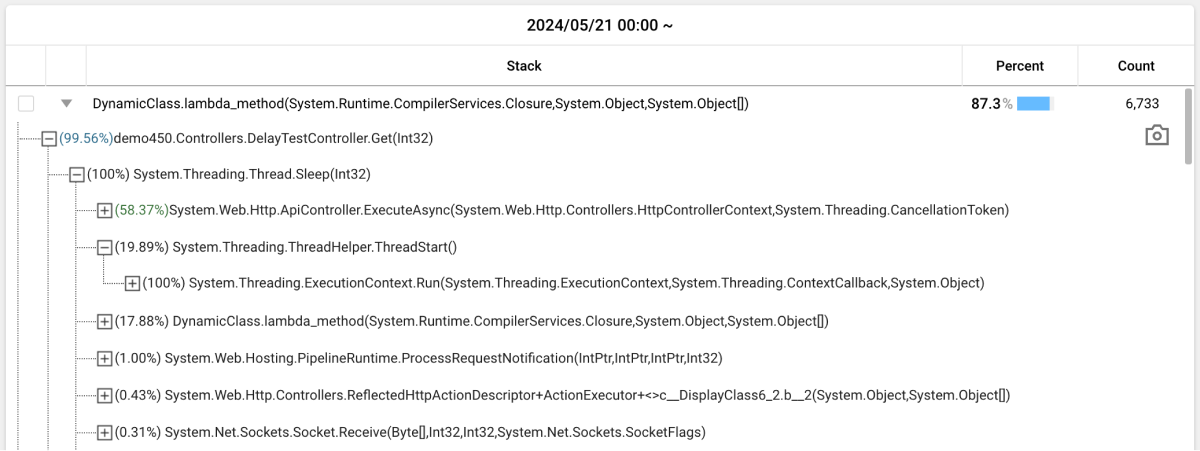
If you select ![]() on the utmost left of each step, the call frequency reference of the upper step that calls the step is calculated as percentage.
on the utmost left of each step, the call frequency reference of the upper step that calls the step is calculated as percentage.
The Top stack statistics are good to make decision with enough data. If the number of collected stacks is a prime number of less than 10, it is insufficient to have a statistical significance.
Top stack is useful to find tuning points that were difficult to recognize while tuning. The most frequent stacks can be determined to cause the most response delays in the application server. The rate on the utmost left is how much it affects the performance of the application server.
Even if it is a stable application server, a stack with a high call frequency is likely to cause performance degradation, so it is recommended to look at the class carefully.
If you click Top stack, the frequency of calls on the top stack can be checked. Because the call relationship of the Top stack is one-to-one, the data accuracy may decrease as the depth of the Top stack goes down. Use the information on the sub-depths for reference purposes and proceed with tuning.
To improve the application performance, the module with a high backlog rate in the top-level step must be checked for bottleneck. For modules with high backlog rates, even a small performance improvement can lead to significant enhancement throughout all applications.
View as Diagram
It provides the diagram chart to help you easily understand the call steps of complex stacks. Select View as Diagram at the upper right of the stack table. This allows you to see at a glance the call frequencies and execution paths of each step.
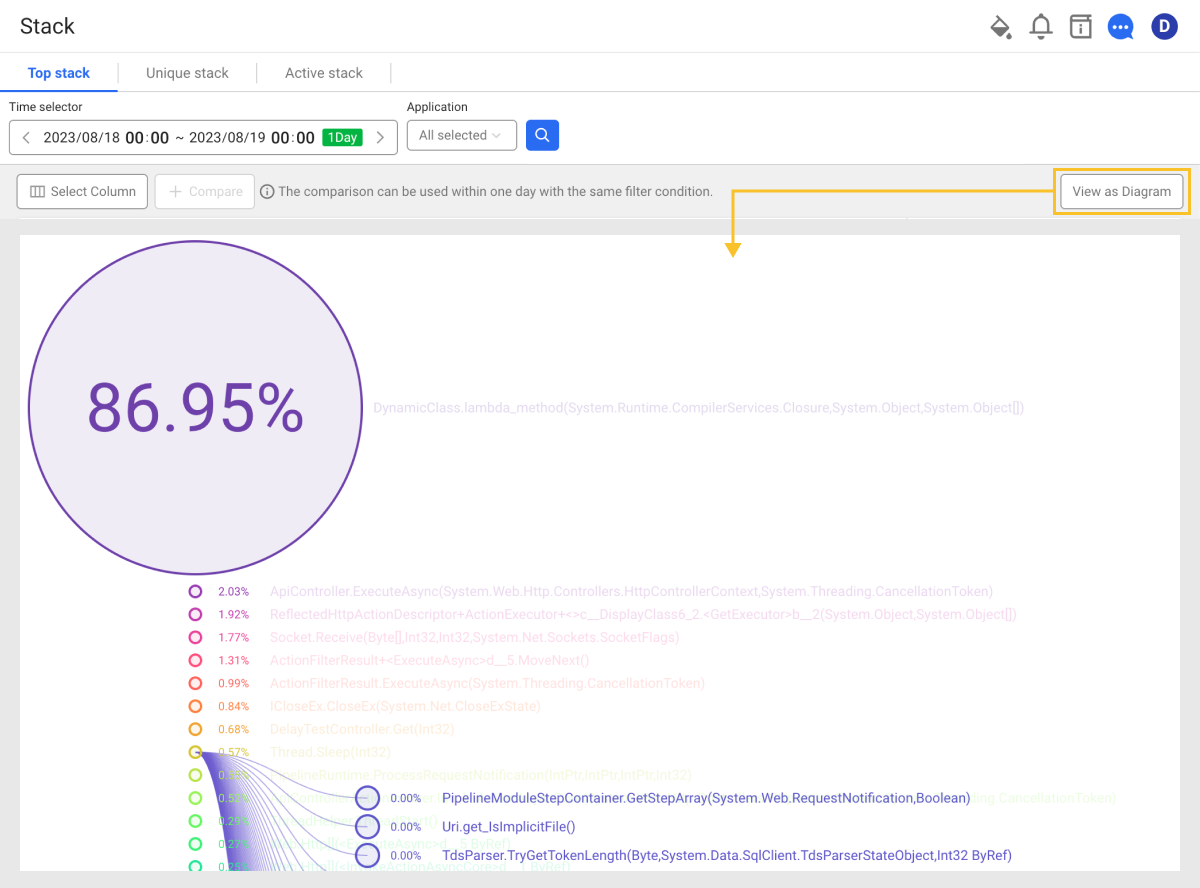
-
If you select each node, the stacks of lower depths appear.
-
You can zoom in/out by scrolling the mouse or move it by dragging.
-
To go back to the list of stack table, select View as table.
Precautions
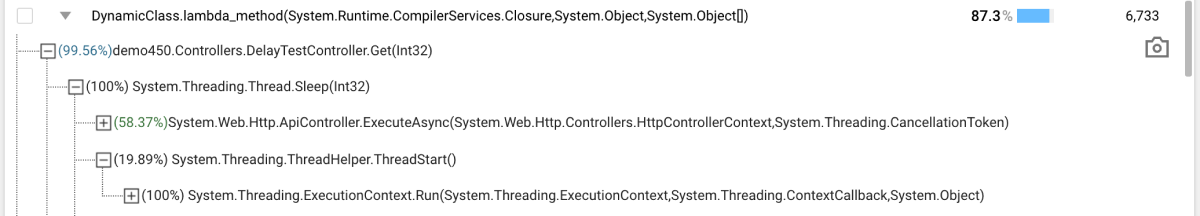
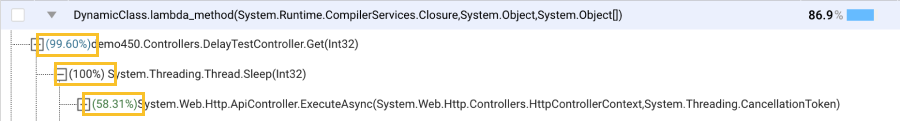
System.Threading.Thread.Sleep(Int32)
// The call rate of System.Web.Http.ApiController.ExecuteAsync is 58.37%.
System.Web.Http.ApiController.ExecuteAsync(System.Web.Http.Controllers.HttpControllerContext,System.Threading.CancellationToken)
// The call rate of System.Web.Http.Controllers.ActionFilterResult.ExecuteAsync is 99.99%.
System.Web.Http.Controllers.ActionFilterResult.ExecuteAsync(System.Threading.CancellationToken)
The call rate of System.Threading.Thread.Sleep ← System.Web.Http.ApiController.ExecuteAsync ← System.Web.Http.Controllers.ActionFilterResult.ExecuteAsync does not mean 58.37% * 99.99%. This is because there is a possibility of calling other modules in System.Web.Http.ApiController.ExecuteAsync.
When determining the call rate through Top stack, do not multiply the call rates between steps to calculate the overall call relationship. Because the call rate of the top stack is the result of the call rates between steps of the data exposed on the stack trace, the total call rate derived with the call rates between steps can lead to a distorted result.
Unique stack
Unique stack provides statistical information about the cases where the set of methods executed based on the exact call information throughout all stack traces is the same.
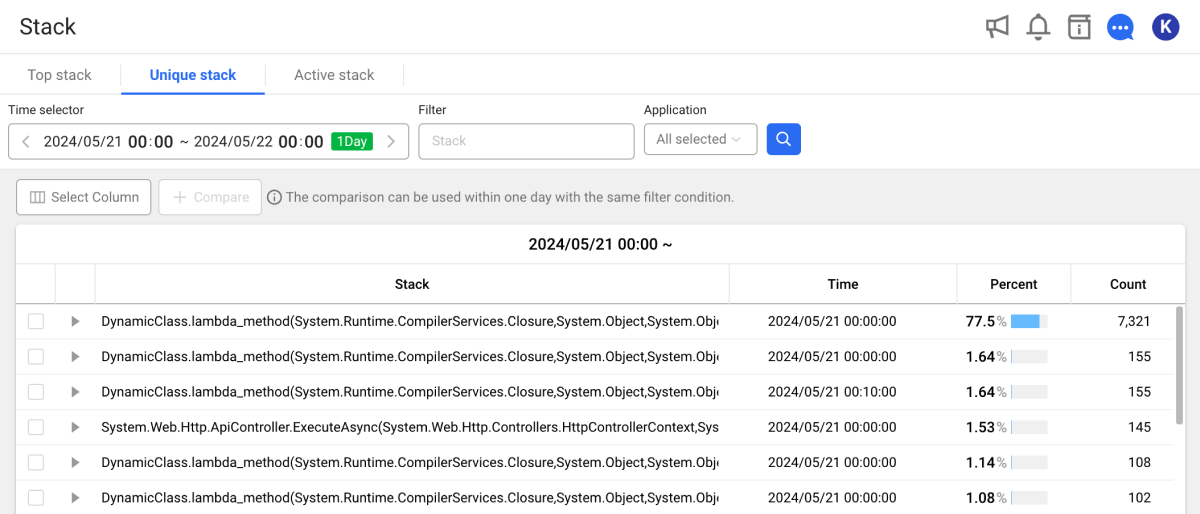
You can find information about the most frequently used stack. Even if the same stack is repeated multiple times, duplicates can be removed to identify the stack with the highest call frequency. For example, you can identify the stack traces with high backlog rates. You can also determine whether abnormal modules exist on the call path by reviewing detailed call steps.
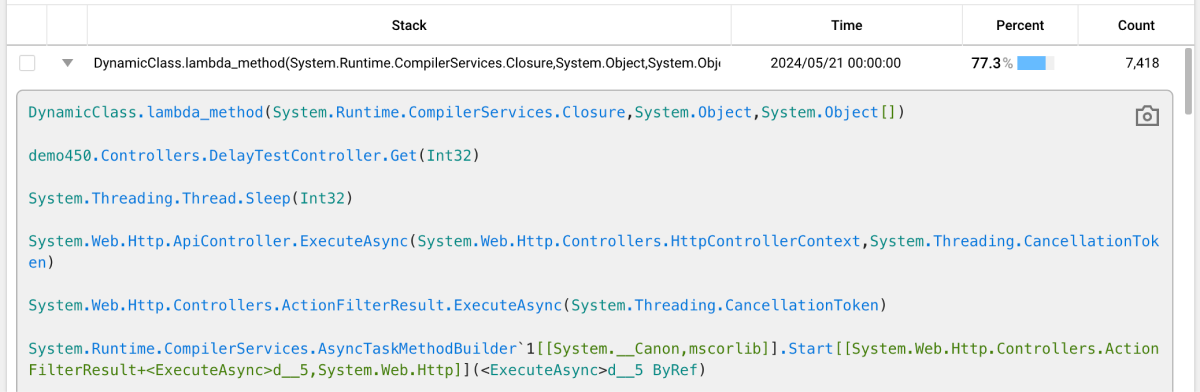
Each stack displays the call path (Stack), occupied percentage (Percent), and total call count of the method. Displays (Count). If you select ![]() on the utmost left of each step, useful information for problem analysis is provided, such as method name, file name, and line number of the call stack.
on the utmost left of each step, useful information for problem analysis is provided, such as method name, file name, and line number of the call stack.
Filtering
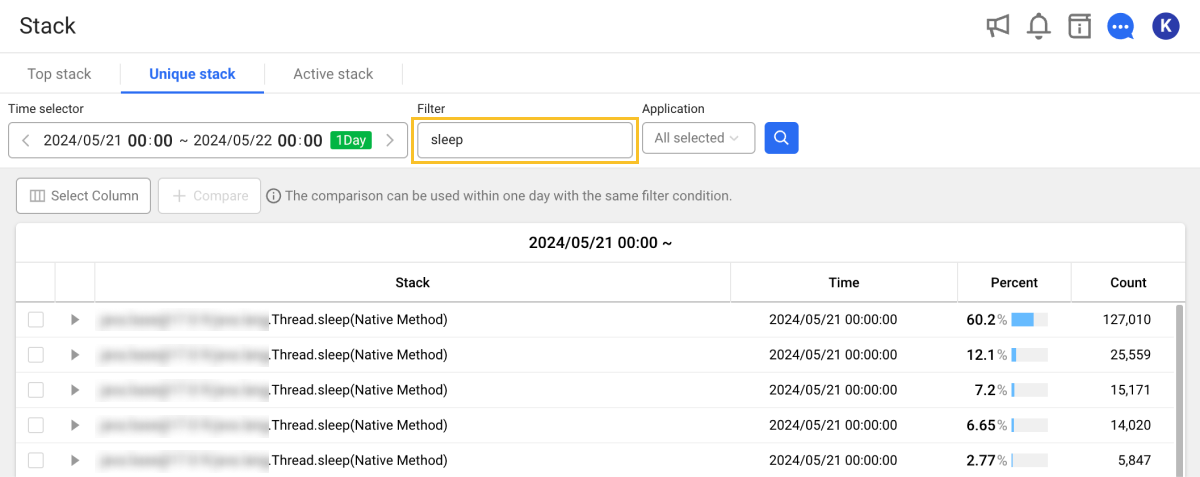
You can filter the search results by entering the method name in Filter. Enter the string and then select ![]() .
.
Active stack
Transactions in progress are called "active transactions." The stacks regularly dumped by active transactions are called Active stack.
In Active stack, you can see the collected Active stack in a time-series chart. The ratios for long-running methods and short-running but frequently executed methods allow you to understand the status of active transactions in real time.
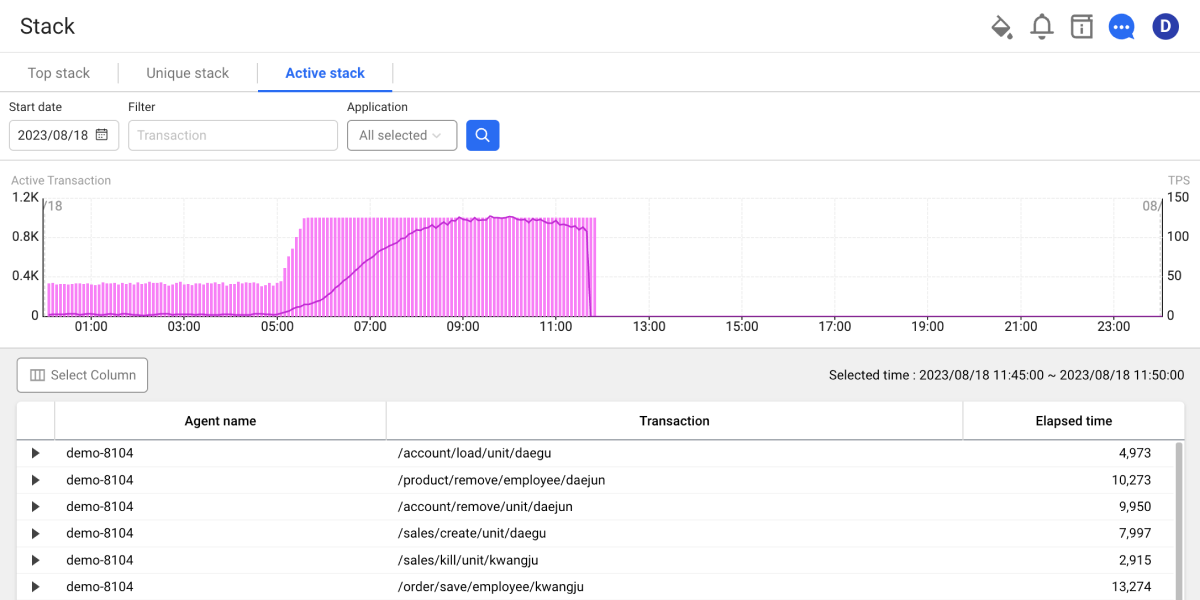
The chart uses the 5-minute unit statistical data to display the number of active transactions on a bar graph and TPS on a line graph. If you click the bar graph for a specific time zone, you can see a list of active transactions for the time zone.
If you select ![]() on the utmost left of the transaction list, you can see the Active stack information of the transaction.
on the utmost left of the transaction list, you can see the Active stack information of the transaction.
-
For more information about collection of active transactions, see the following. For other agent options related to the collection, see the following.
-
The WhaTap agent transmits active stacks dumped from active transactions to the server every 10 seconds (optional). For the agent option about the collection interval, see the following example.
whatap.confactive_stack_second=10
Filtering
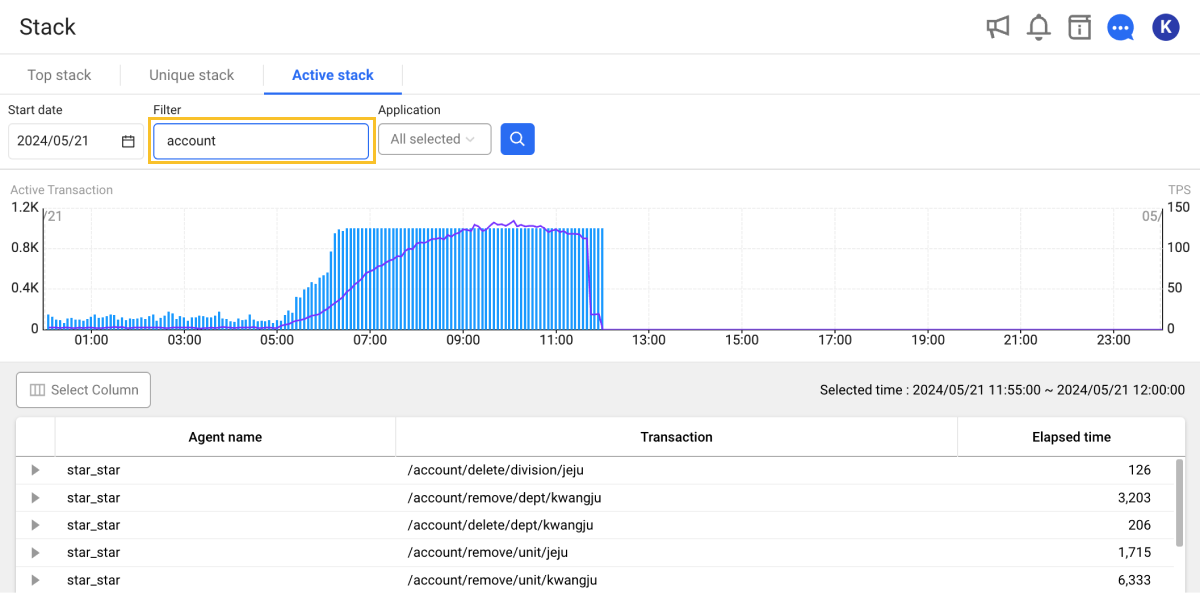
You can filter the search results by entering the transaction name in Filter. Enter the string and then select ![]() .
.
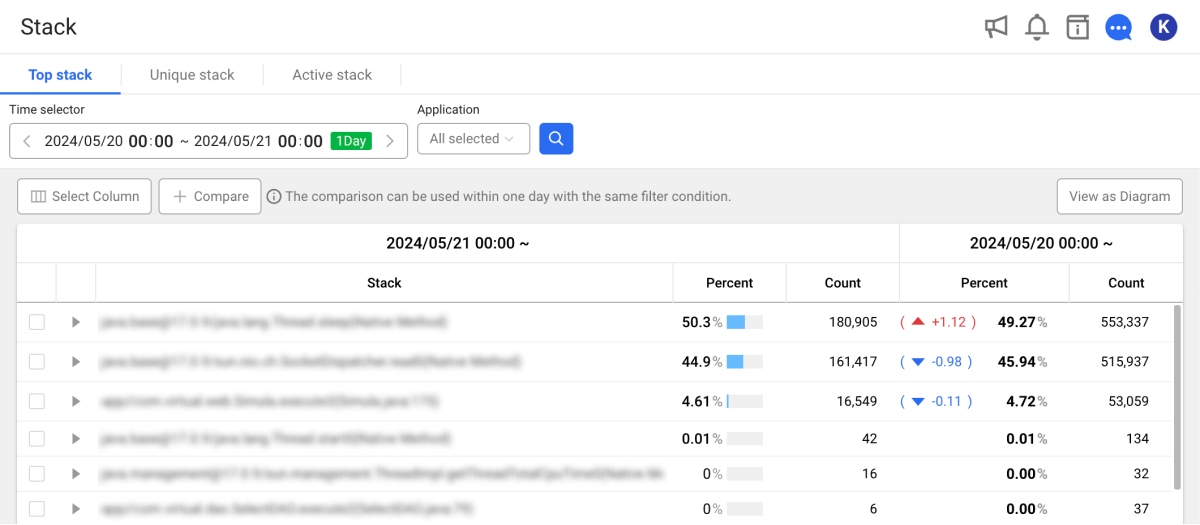
Comparing stacks
Top stack and Unique stack provide the history of rate changes and collection counts over time based on a specific period of time.
Set the time to view in Time selector, and then select Compare. You can compare stacks over time when viewing the within 1 day period under the same filtering condition. This allows you to see the changes in the call stacks over time and see the performance trend. It can also be used as useful data for checking incident points and comparison before/after the performance improvement.
-
Percent: You can see the rate changes of the selected stack during the inquiry period.
-
Count: The number of collected stacks is proportional to the number of active transactions. For example, if the collection amount increased in a specific section, it can be seen that there was a service delay or a sudden increase in inflow.
If Compare is not enabled, you may have exceeded the inquiry time range or there is no enough data for comparison. Set the inquiry time range in Time selector to enable the Compare button.