Report
Home > Select Project > Stat/Report > Report
If you click ![]() in Report on the screen, you can see various analysis reports classified by daily, weekly, and monthly. Select a desired report format, and then set the date and time to view and filtering options. You can check the selected report by selecting
in Report on the screen, you can see various analysis reports classified by daily, weekly, and monthly. Select a desired report format, and then set the date and time to view and filtering options. You can check the selected report by selecting ![]() .
.
Report is a document that reports the service usage status and failure records for individual projects. The persons in charge of service monitoring share the status report with the people of related departments.
The monitoring data analysis is important because it serves as a metric for determining the direction of improvement. However, it is cumbersome to aggregate and document data from multiple dashboards.
WhaTap's Report menu supports automated report creation. Through the Report menu, you can create weekly reports, share reports at the set times, and manage various templates.
To download, print, or schedule to send reports or emails, click the button. Downloading is available in HTML format.
Report types
The basic report is a form that is actually used by large enterprises, government agencies, and IT service companies. If you have any desired form, please send a request to support@whatap.io. The requested report template is to be added in the Stat/Report > Report list.
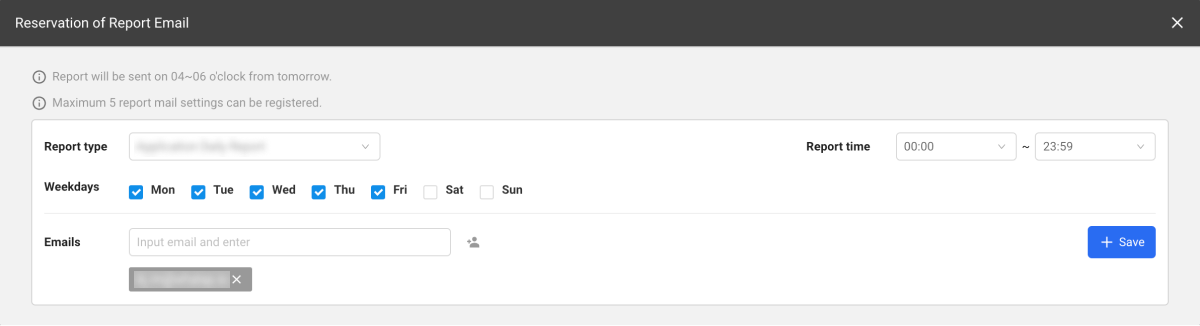
Email delivery schedule
To receive regular reports by email, select Reservation of Report Email. You can replace various service checking tasks performed right after work with email confirmation.
Daily DB Report
The daily database report allows you to check the database performance for the day in figures and charts. When creating a report, you can set the start date, start time, and end time if necessary, and you can select and view only specific instances. When all is selected, all instances are viewed at once.
Trend Chart
You can see metrics charts for each database instance. The maximum value of each metric is displayed in circle, and the time when the maximum value occurred is also displayed.
-
Metrics drawn as charts may differ depending on the configuration.
-
On the upper right of each chart, use CSV to download the data in an Excel file format.
SQL Top 10
You can check the statistics of SQL queries during the query period for all or selected instances. It retrieves only the top 10 sorted items in descending order based on the maximum value of query execution time.
Weekly DB Report
The weekly database report displays the database performances for the week with figures and charts. You can enter the start date and see from 7 days prior to the day of inquiry.
Trend Chart
You can compare weekly metrics for each database instance with figures and charts. The maximum value during the query period is displayed in circle and the occurrence time is also displayed.
-
Metrics drawn as charts may differ depending on the configuration.
-
On the upper right of each chart, use CSV to download the data in an Excel file format.
SQL Top 10
You can check the statistics of SQL queries during the query period for all or selected instances. It retrieves only the top 10 sorted items in descending order based on the maximum value of query execution time.
Monthly DB Report
This report allows you to check the database performance for a month with numbers and charts. You can set the start date and search up to 30 days from the start date. You can check the change amount in each metric over a month by instance, and you can also check the SQL query statistics of the top 10 items performed during the query period.