Database size
Home > Select Project > Stat/Report > DB size
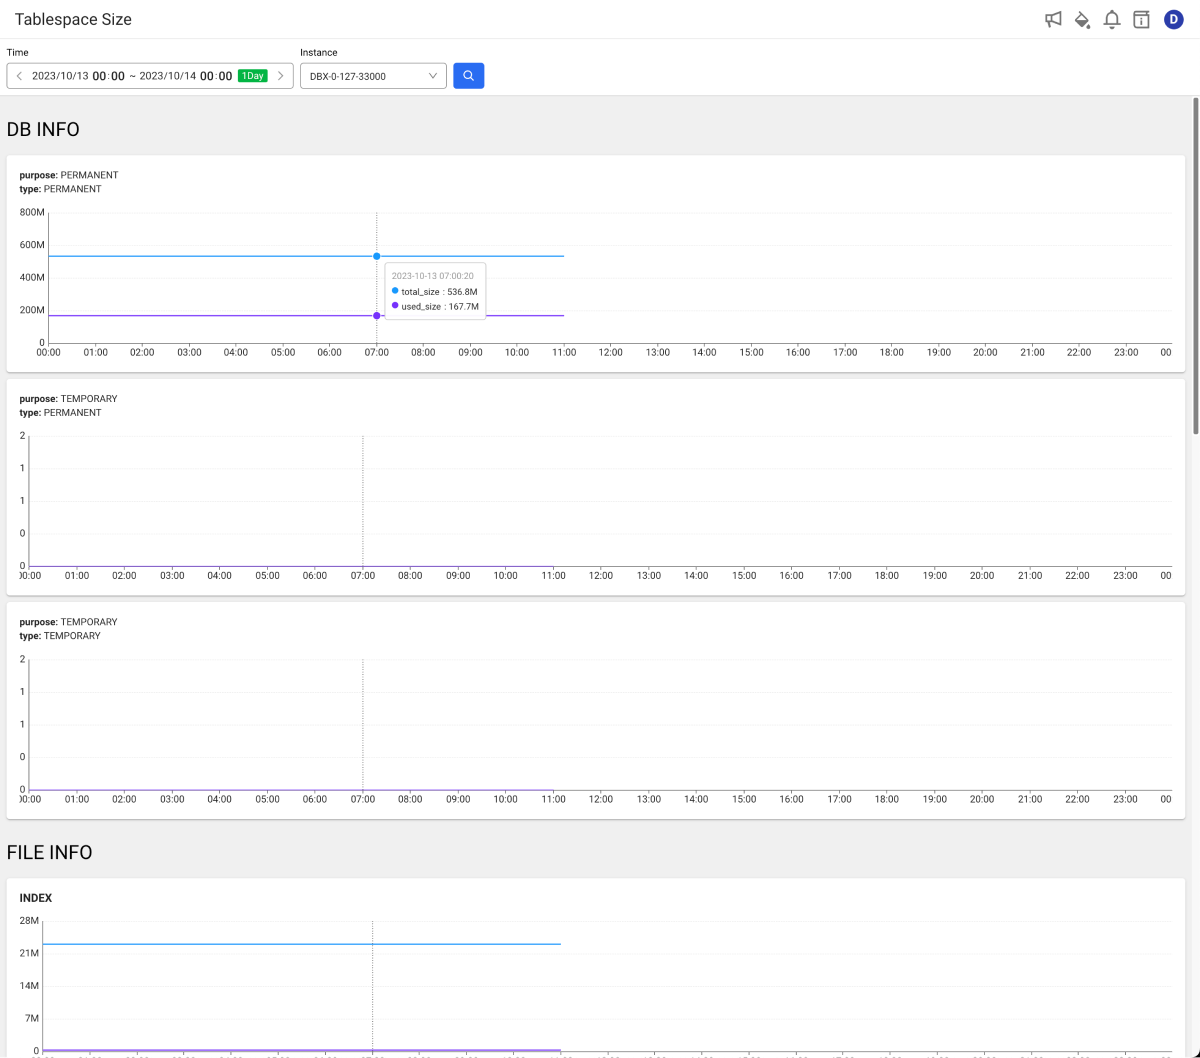
This menu allows you to monitor and manage the usage status of the database. This menu provides a visual representation of the overall size and usage of the database, and allows you to see the usage details.
-
You can visually check the changes in database size and usage over time.
-
It provides the details on the total size, used amount, and used percentage for each database.
By monitoring the usage of the database in real time, you can check the usage and manage the capacity appropriately. By tracing high-usage databases, take actions to manage the capacity and optimize the performance. It can also proactively detect and respond to excessive database usage.
Basic usage guide
In DB size, you can check the space usage of the database and the size and usage of the actual files used in the file system.
-
In Time, set the period to be analyzed.
-
In Instance, select an instance of the database to be analyzed.
-
Select
.
-
The query period can be set up to 3 weeks. In case of a view for 3 days or more, the graph displays the daily average
-
For more information on how to use the Time option, see the following.
SPACE
It visualizes the space usage in the database over time. You can check the total space, used space, and usage rate of major databases such as PERMANENT, TEMPORARY, Active_log, and Archive_log.

-
PERMANENT: It is the space occupied by data that is permanently stored in the database.
-
TEMPORARY: It is the space to store temporary data.
-
Active_log: It is the space where the current transaction logs are stored.
-
Archive_log: It is the space where completed transaction logs are stored.
FILE
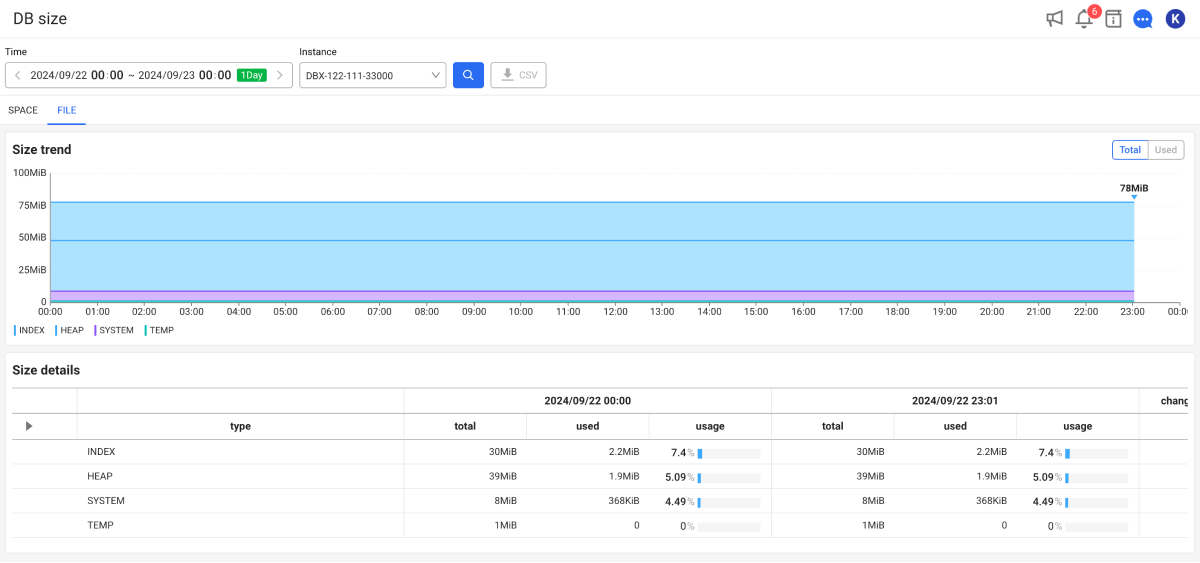
You can check the size and usage of actual files used in the database file system. You can analyze database file systems subdivided into INDEX, HEAP, SYSTEM, TEMP, and such.

-
INDEX: It is the file where the database index is stored.
-
HEAP: It is a file that stores the actual table data of the database.
-
SYSTEM: It is a file that stores system-related information of the database.
-
TEMP: It is a file that stores temporary data.
Checking the size change
In the Size trend section, you can visually see the overall size and usage change of the database over time.

To see the data for a specific period on the chart, hover your mouse over the chart and then move it. You can check detailed information about the time zone in the tooltip.
Checking the size details
In the Size details section, it provides detailed information for each database.

You can see the usage changes of each database by comparing the time of the first query with the current time. To see the details of the database, select next to the database name.
-
total: Size sum of all databases.
-
used: Total size of the databases in use.
-
usage: Usage rate calculated by (
used/total) 🞨 100. -
changed amount: It is the change in usage as of the current time compared to the first query time.