Comparison between count trends
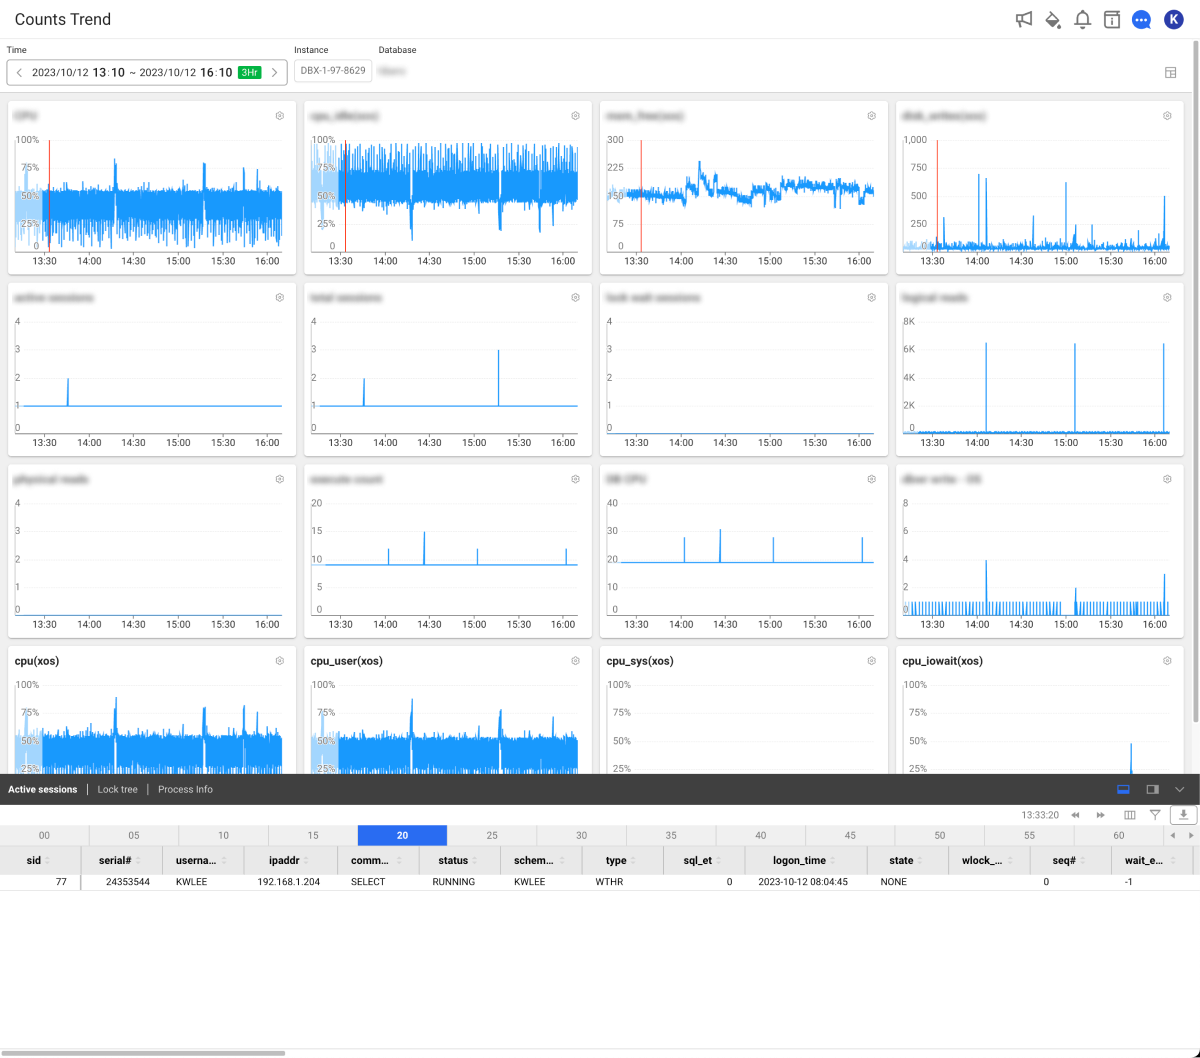
Counts Trend
Home > Select Project > Analysis > Counts Trend
You can check the operation trend of the key metrics of the database over time and trace the performance. You can check the current active session data and distinguish the long-running sessions.

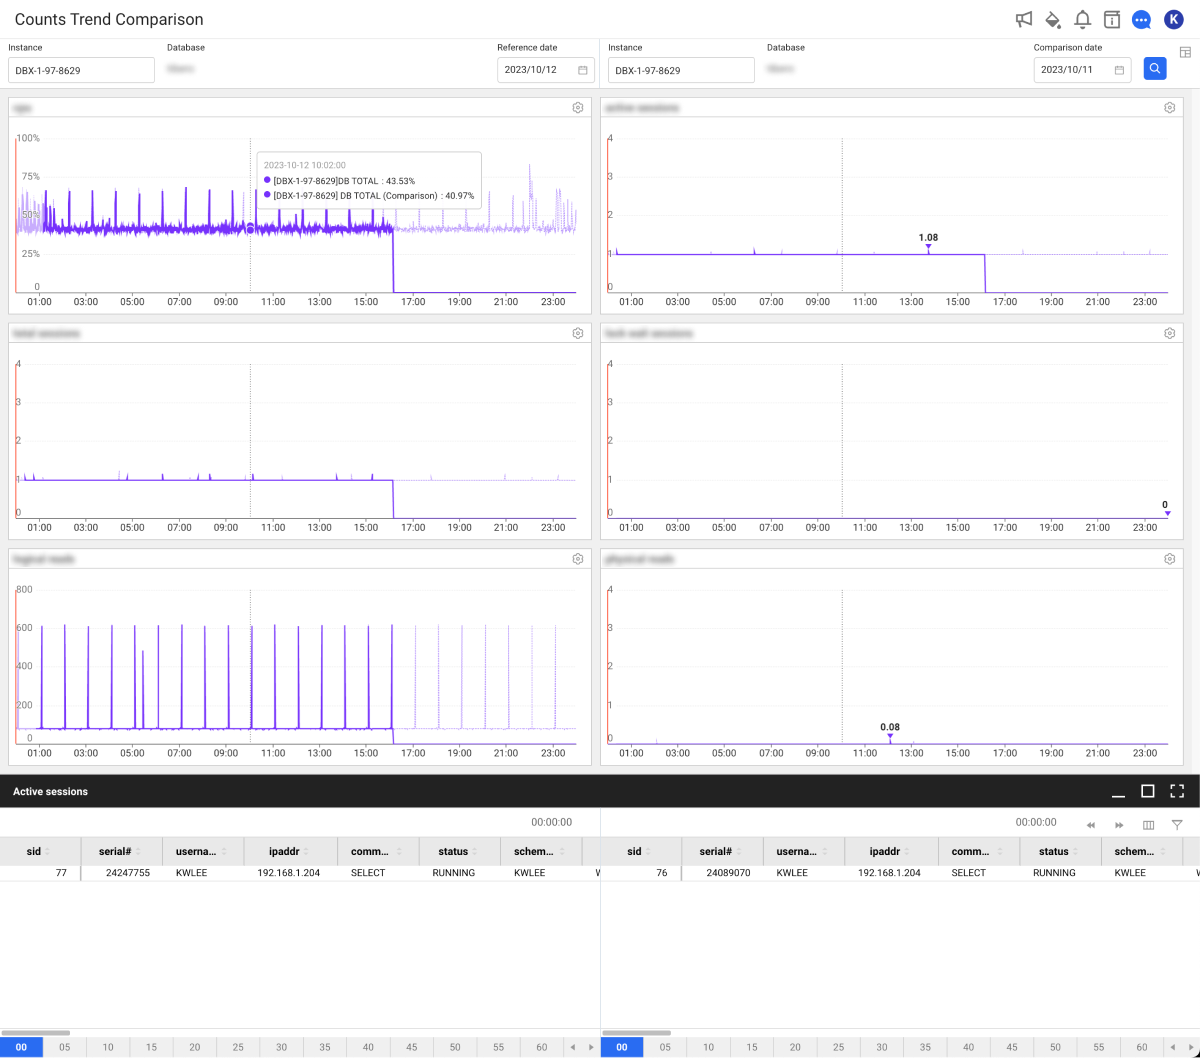
Comparison between count trends
Home > Select Project > Analysis > Counts Trend Comparison

You can compare the count trends for different dates.
-
Select the desired instances from the Instance area. You can also select different instances.
-
Set values for Reference Date and Comparison Date.
-
Select
.
Using the chart and active session area
Select on the screen. In the Layout setting window, set it to 1 x 3 and then select Save. Time must be set to Last 24 hours. You can see the database key metrics in detail for the day, as follows:

-
In
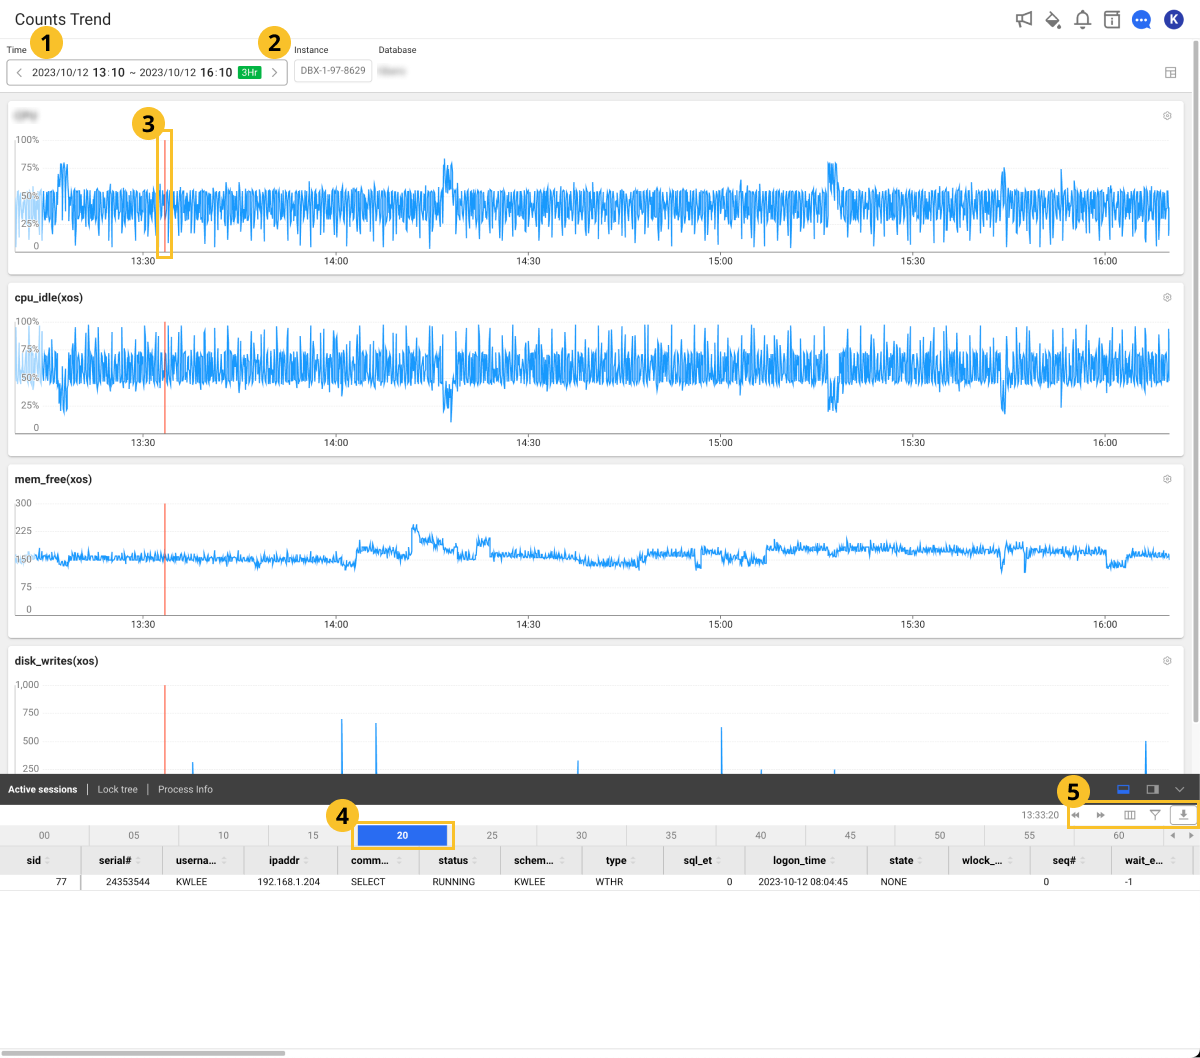
Time, set a desired time interval.
- Click the green icon to select a search time.
- With the lookup period selected, select
or
. Then you can change the lookup time at the set time intervals.
- If you select the date and time, you can set the desired time in detail. After configuration, select Confirm.
-
Instance: You can select an instance that is connected with the project.
-
If you click a specific time point of the metrics chart, the (number3) area appears with red lines and the collected active sessions can be also displayed.
-
To change the metrics in the chart, select
on the upper right.
-
The active session data is collected every 5 seconds. You can search the data by selecting the
5-second cells at the bottom of the screen.
-
To move the time by 1 minute, select
or
.
-
: The column header entries in the table can be displayed or hidden.
-
: You can filter the list based on the column header entries in the table. After selecting the button, you can set the conditions in each header column such as Includes, Excludes, Equal, and Unequal.
-
: You can download the content of the table as a CSV file.
Column information guide
| Item | Description |
|---|---|
instance | Agent or instance name. |
pid | PID of the database process. |
dbname | Name of the connected database. |
user | User name connected to the database. |
query_time | Query execution time. |
transtatus | Current state of the transaction. |
query | Executed SQL query. |
query_hash | Hash value of the query. |
query_param | Parameters used for a query. |
program | Program information executed by the client. |
tranindex | Unique number that identifies the running transaction. |
tran_time | Time elapsed since the transaction began. |
sql_id | Unique ID for the running SQL query. |
time | Task operation time |
lock_holder | Session that has locked the resources in the current transaction. |
WhaTap basically stores the client-related information.