Searching the user session log
Home > Select Project > Analysis > User Session Log Search
End users can search using various conditions and identify the user session log by collecting the performance data, error data, and click data when interacting with the website. User session logs help analyze end user paths, identify reasons for user attrition, and analyze the performance and user experience.
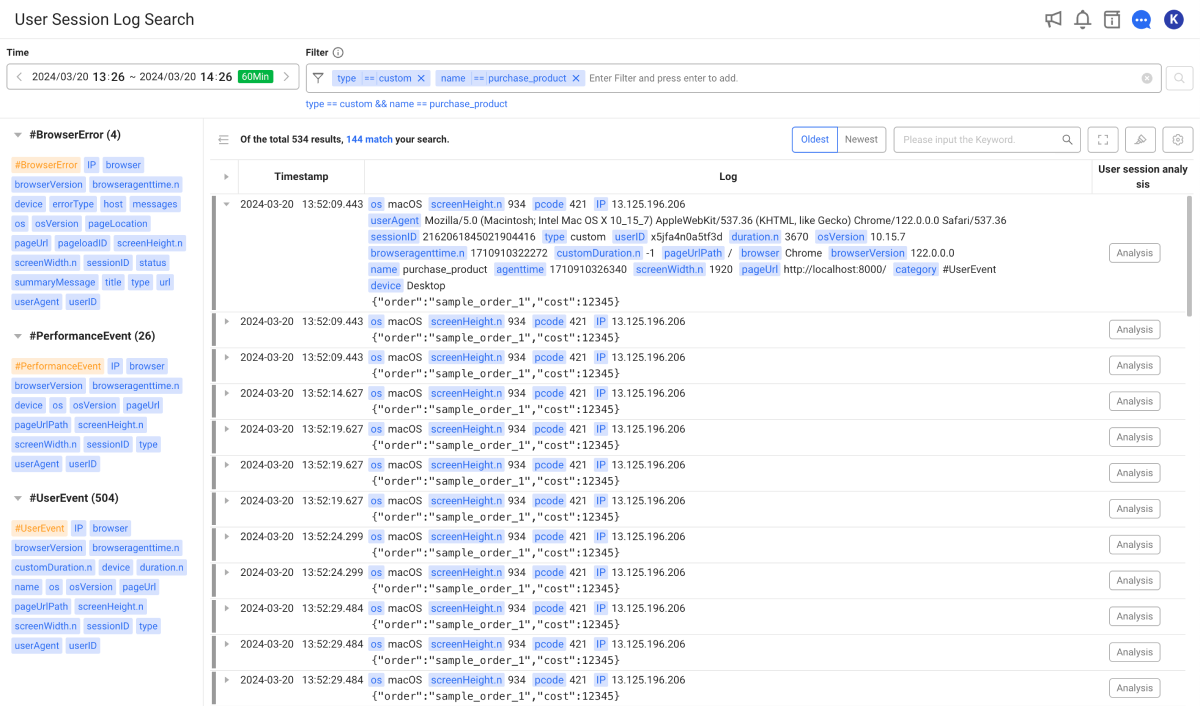
Set the search time to view in the Time option, and then select ![]() . You can set multiple search conditions consisting of keys and values in Filter and then extract only the log data that matches the conditions. Log data is loaded by lines and displayed in a list. When you go to the bottom of the list, the following data is automatically retrieved for display.
. You can set multiple search conditions consisting of keys and values in Filter and then extract only the log data that matches the conditions. Log data is loaded by lines and displayed in a list. When you go to the bottom of the list, the following data is automatically retrieved for display.
Basic operations in User Session Log Search is the same as those of the Log Search menu. For more information about the search methods and other options by setting filters, see the following.
-
For more information about the log search using the filter settings, see the following.
-
For more information about tag options, see the following.
-
For more information about the content highlighting, see the following.
-
For more information about the Table settings function, see the following.
This function can be used by the members with the log search role. For more information about the member role scheme, see the following.
Guide to major search tags
#Category
The user session logs collected by the browser monitoring can be categorized as follows: Each #Category has a list of tags for searching by filters.
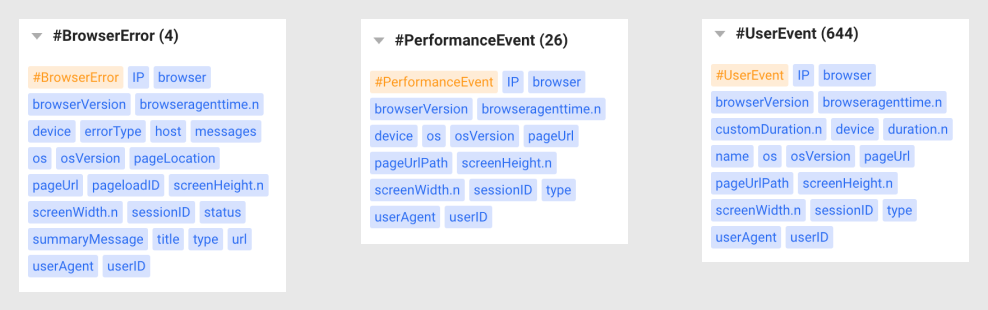
-
#BrowserError: Collects and provides source errors, network errors, and such that occur from the website.
-
#PerformanceEvent: Collects and provides events that are related with page loading, AJAX, and router change.
-
#UserEvent: Collects and provides user click events and custom events.
User session log
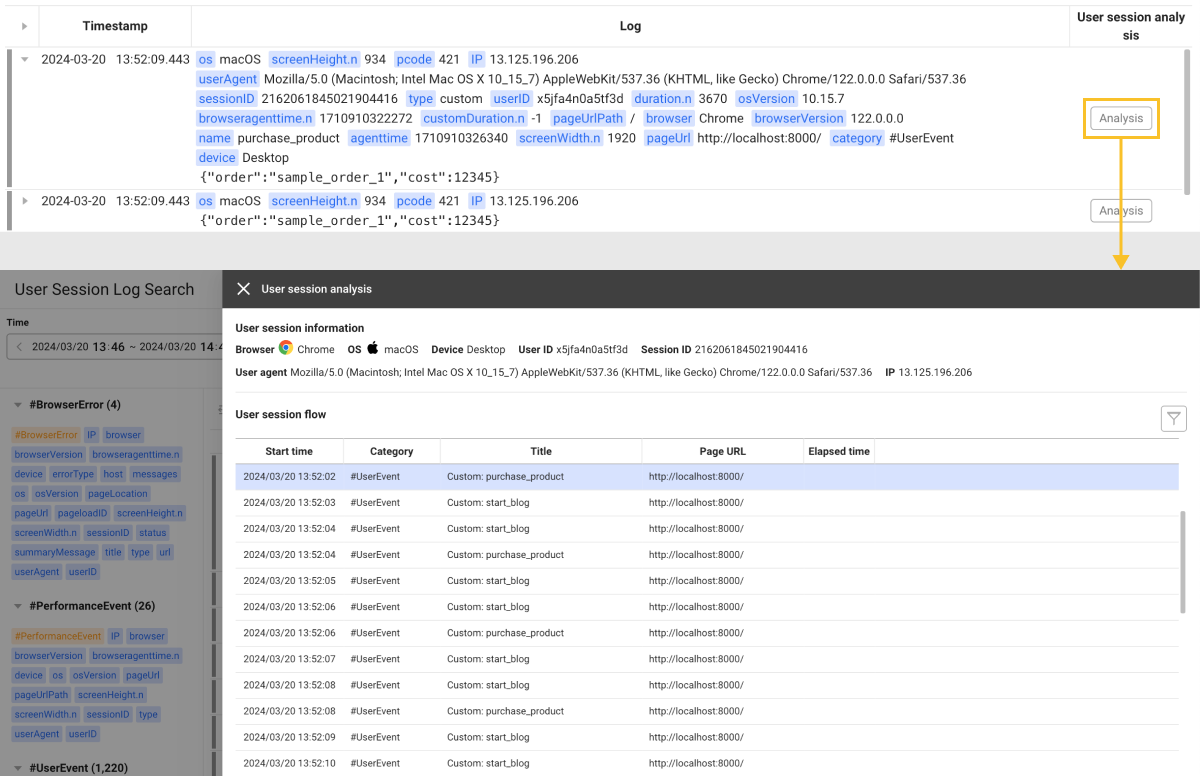
User session logs include the end-user environment and the data collected by #Category. If you select ![]() on the utmost left, you can see the whole data that makes up the log.
on the utmost left, you can see the whole data that makes up the log.
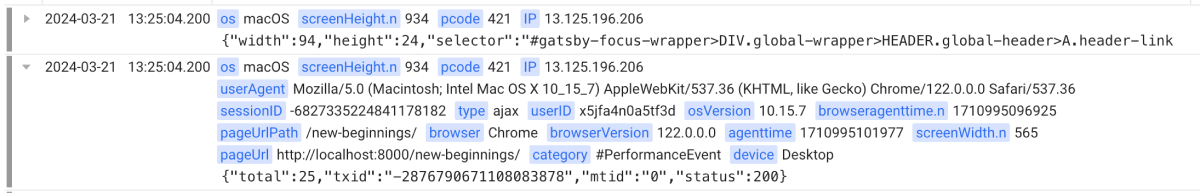
The content of the first line consists of the end user's environment and #Category-based collection data as keys and values. Keys and values are used for search in Filter. The second line is the message of the user's session log.
The following are descriptions for major keys in the user session log.
-
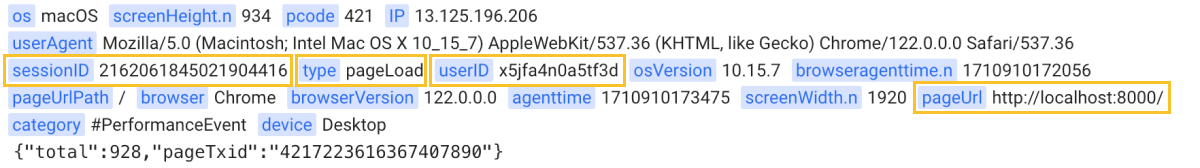
PageUrl: URL of the page where the event occurred. -
userID: ID of the user who generated the event. A unique ID that is issued by the browser agent when a user accesses a website for the first time. It has no expiration time. IDs are stored in browser cookies. -
sessionID: ID of the session that generated the event. A unique ID issued when a user starts navigation of the website. The maximum duration of a session is 4 hours, and the ID expires after 15 minutes of inactivity. IDs are stored in browser cookies. -
type: Type of the generated event.-
pageLoad: Event that occurs upon loading the website.
-
routeChange: Event that occurs upon change in the route of the SPA website.
-
ajax: AJAX request-related event
-
click: Event that occurs when an actual user clicks on the website.
-
rapid_click: Event that occurs when an actual user quickly clicks on a single coordinate multiple times.
-
custom: Custom event.
-
browser_error: Source errors, network errors, and the like in the website.
-
-
For the agent configuration option (
collectUserClick: true) to collect user click events, see the following. -
For more information about collection of custom events, see the following.
Analyzing the user session
In the viewed user session log list, select Analysis in the User session analysis column. The User session analysis window appears where you can see the details of the user session log for the selected item.
Based on the user session, you can see the events and errors that occur while interacting with the website in chronological order. You can use the user session analysis as the following and enjoy better user experience.
-
On-page behavior analysis: You can understand how the user navigates the website. It can analyze user activities on how you navigate, which pages you stay on, and which elements you click on. This helps you gain insight into how users use the website and understand the user behavior patterns by analyzing user paths.
-
Error tracing: You can trace all types of technical issues (Java script errors, network errors, etc.) that occur during user sessions. You can monitor and analyze user behaviors such as clicks and page movements to find causes of failures.
-
Finding the cause of customer attrition: You can reduce the churn rate by tracing user attrition from a specific page or failures to complete specific tasks, analyze the causes, and improve the area.
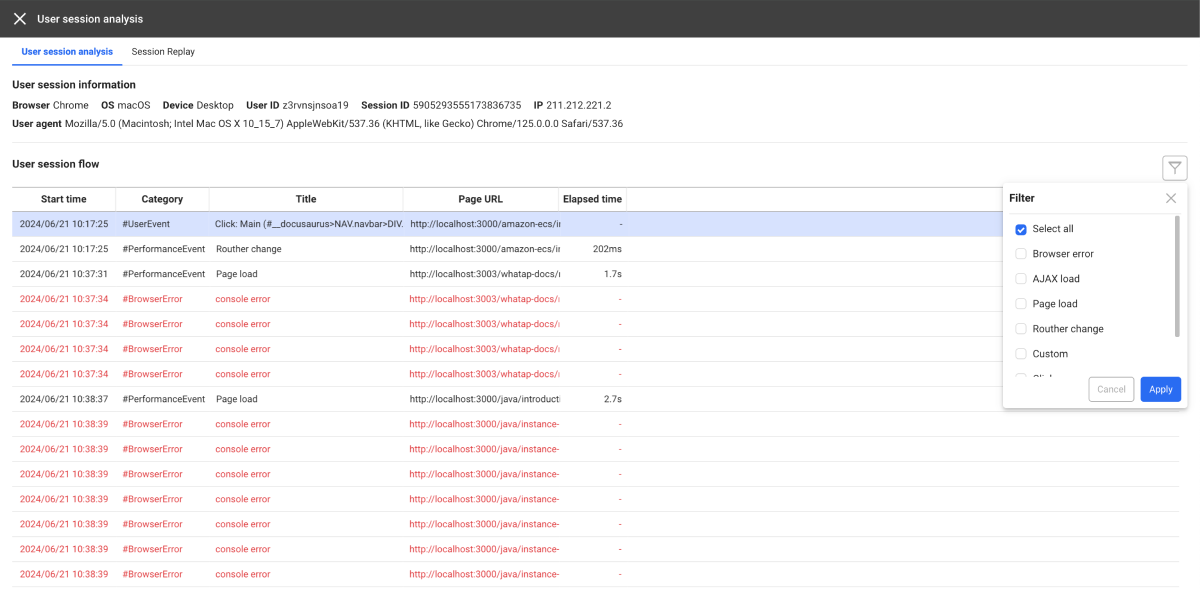
User session information

You can view information such as end user's browser and OS, user agent, user ID, session ID, and client IP.
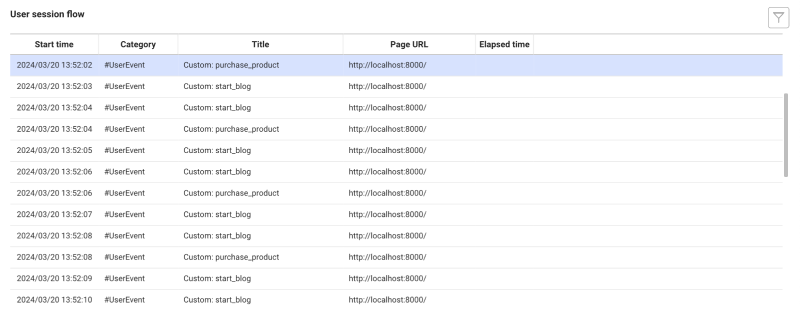
User session flow
Based on the user session, you can check the performance data, events, and errors that occur when actual users interact with the website.
Checking the event information details
The types of events displayed in the Title column of the User session flow list are divided into the following. Select a user session event to see the information details about the event.
Page load(pageLoad)
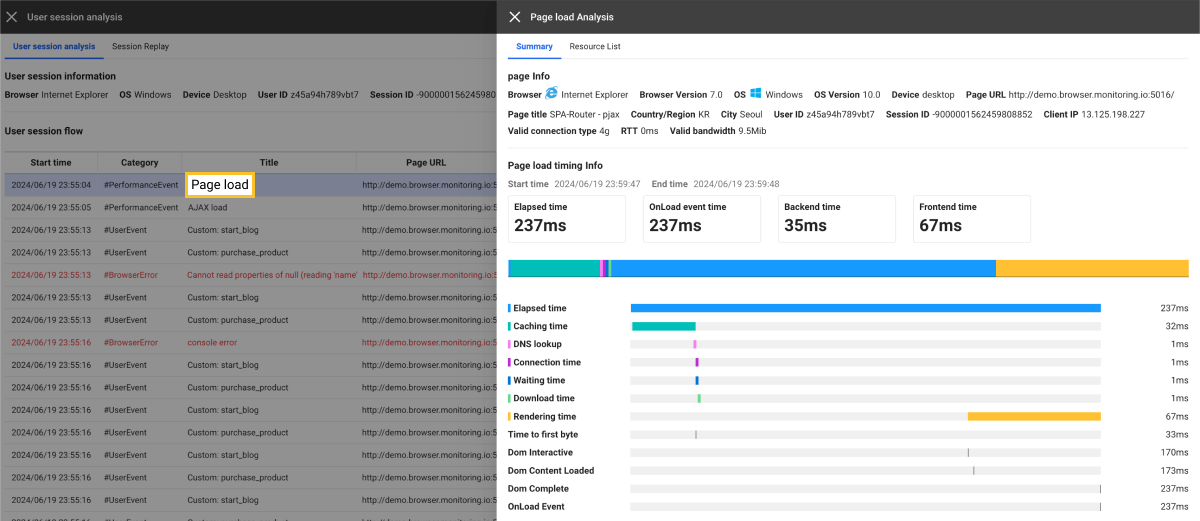
Event that occurs when the website is loaded. You can check the detailed time and loaded resources for each event section. If you select the User session analysis tab, the related information is displayed consequently.
For more information about the page load analysis, see the following.
Routher change(routeChange)
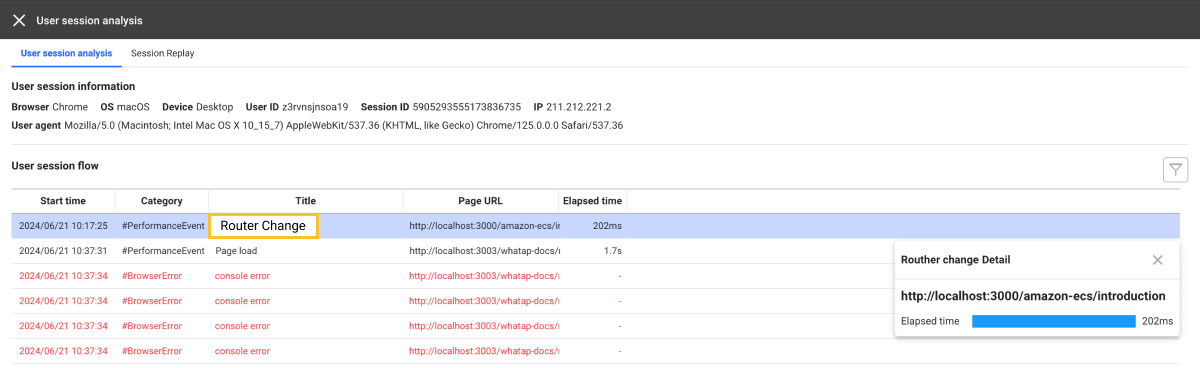
This event occurs when the route is changed on the SPA website. You can see the time taken to change the router.
AJAX load(ajax)
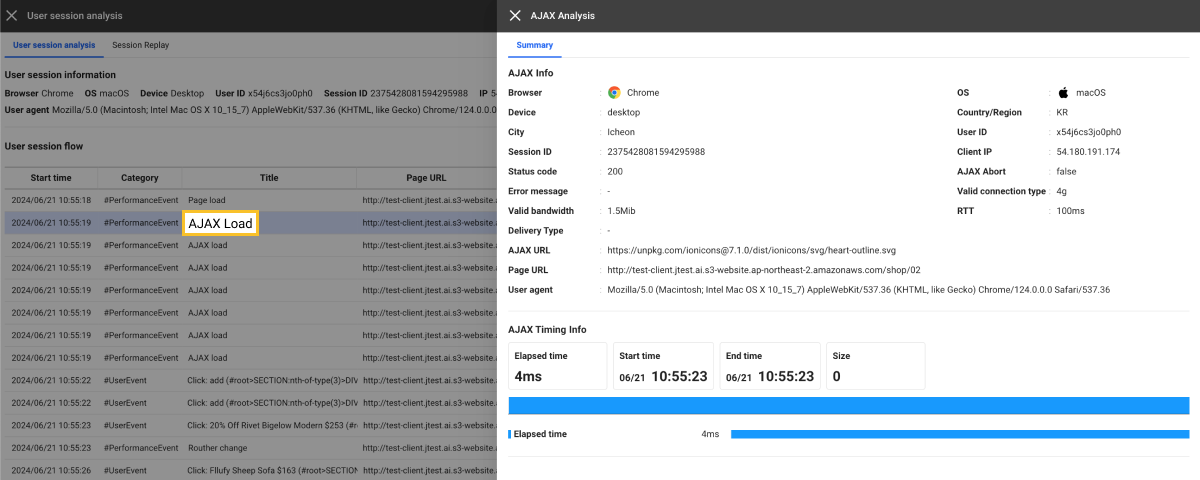
AJAX request-related event. You can check the detailed time information, AJAX request URLs, call pages, error messages, and such for each AJAX event section. If you select the User session analysis tab, the related information is displayed consequently.
For more information about the AJAX event analysis, see the following.
Click(click) / Rapid click(rapid_click)
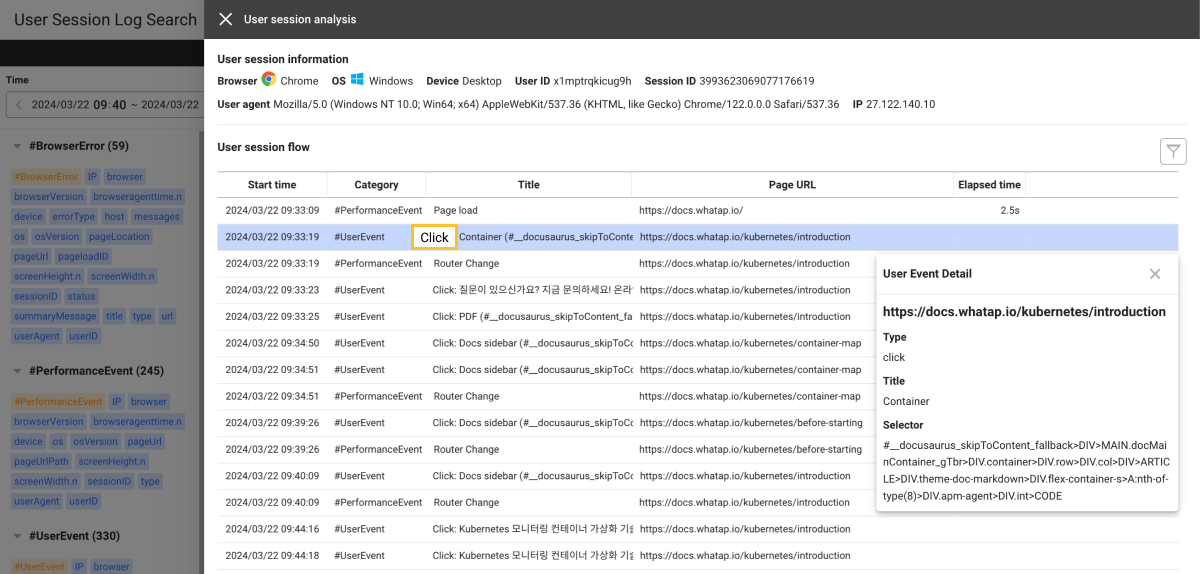
You can see the selector that is the ID of the element clicked by the user, and the text information of the element. This helps you find which elements users clicked on which pages.
To collect click events, it is required to set the option (collectUserClick: true) in the browser agent. For more information, see the following.
Custom(custom)
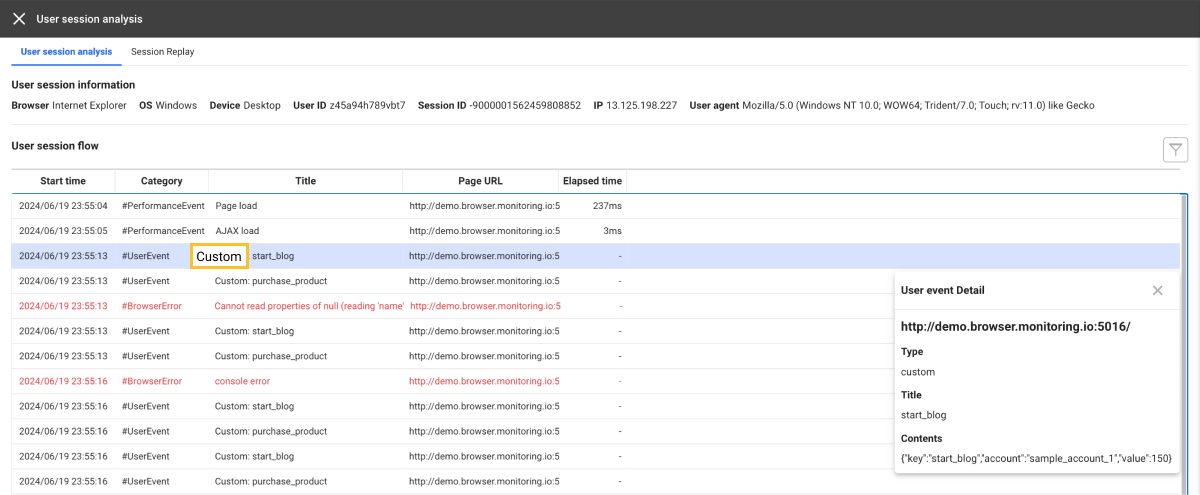
You can check the information collected by custom events. It displays the information included in the title (name) and contents that are representative values of custom events.
For more information about collection of custom events, see the following.
Browser error(browser_error)
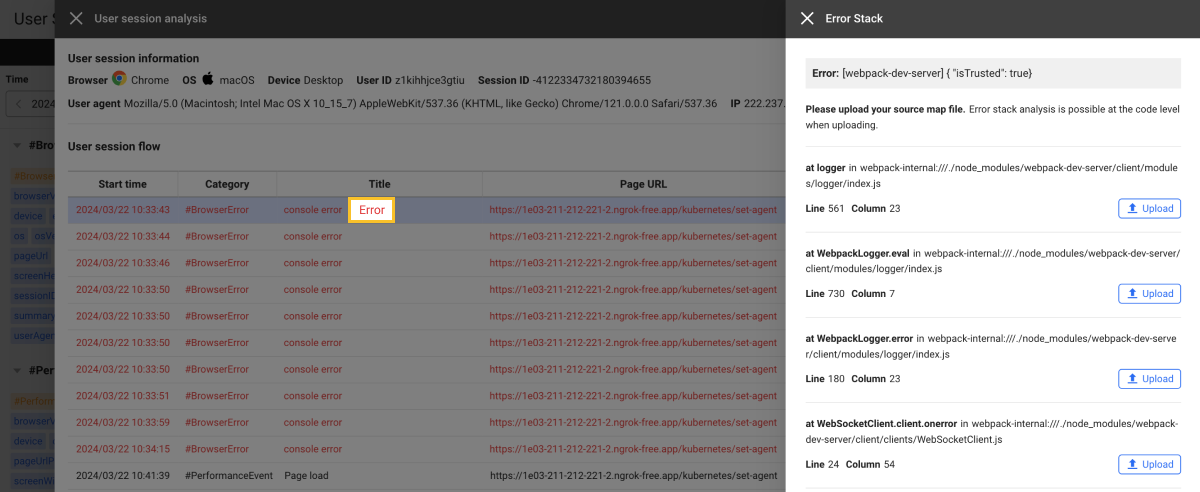
You can see source errors, network errors, and the like that occur from the website.
For more information about error tracing, see the following.
Event-based filtering
-
On the upper right of the User session flow list, select
 .
. -
In the Filter list, select an event type.
-
Select Apply.
Session replay
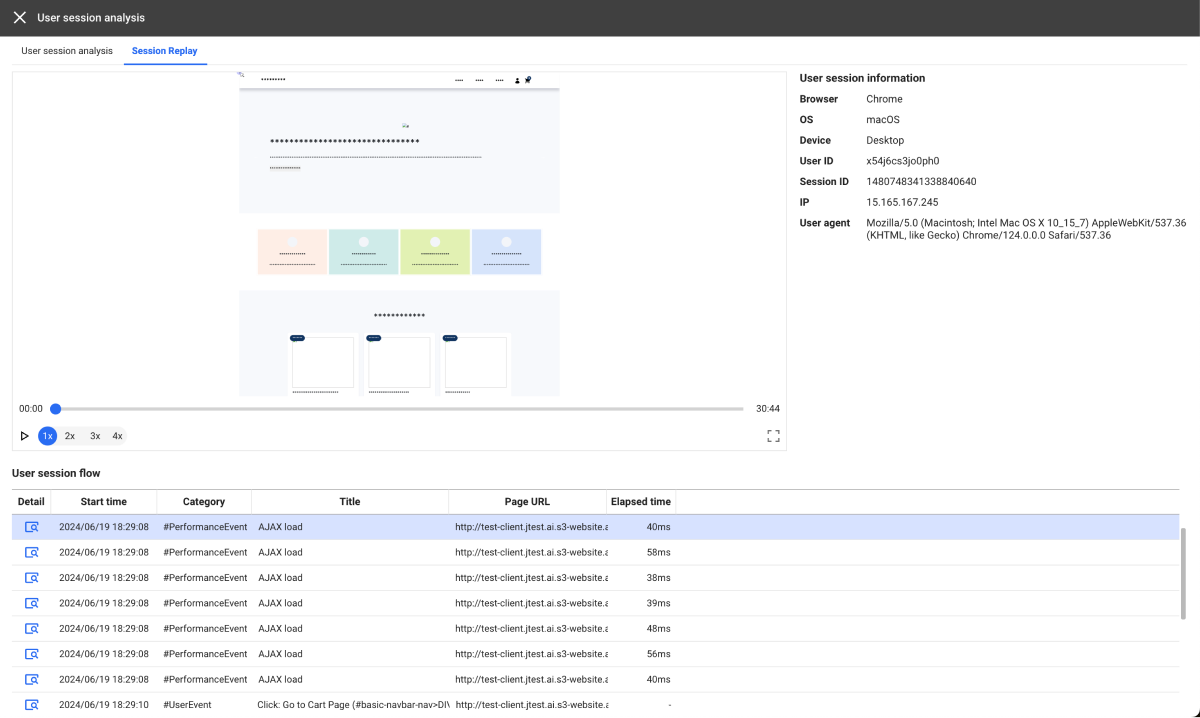
It provides the feature to record and replay all events that users perform on the website. The Session replay feature allows you to reproduce user behaviors such as clicking, scrolling, typing, and page switching. This helps you understand exactly how users actually interact with the website.
-
For information about application of the Session replay feature by using agent options, see the following.
-
For more information about using the Session replay feature, see the following.