Session Replay
Session replay is a feature that allows to record and replay all events performed by users on the website. This feature allows you to reproduce user behaviors such as clicking, scrolling, typing, and page switching. This helps you understand exactly how users actually interact with the website.
-
Record and replay user behaviors: Session replay records user behaviors. Recorded user behaviors include mouse movements, clicks, scrolling, and more. You can replay recorded user behaviors to visually see what they were doing at a specific time.
-
Error tracing and failure reproduction: You can analyze the cause of a failure by tracing the occurrence time of a specific event or error. You can visually check how users see when a page takes a long time to load or other technical glitches occur on the screen.
The Session replay feature can be used by the members with the View log role. For more information about the member role scheme, see the following.
Supported browsers
Data collected for session replay is collected from only the browsers that support the requestIdleCallback API. Check the supported versions for each browser.
| Chrome | Edge | Safari | Firefox | Opera | Chrome Android | Safari iOS | Samsung Internet |
|---|---|---|---|---|---|---|---|
| > 47 | > 79 | > 8 * | > 6 | > 55 | > 47 | > 9 * | > 5 |
To avoid overheads during session replay data collection, data is collected in idle time of the main thread. For this purpose, use the requestIdleCallback API.
The requestIdleCallback API is designed to perform a callback when the browser is idle, making sure that it does not interfere with the main tasks while collecting the session replay data. For more information, see the following link.
- Safari and Safari iOS do not support the requestIdleCallback API, so session replay data is not collected by default. Setting the sessionReplayCollectAllBrowser option to true enables session replay data collection on these browsers. However, in this case, data is collected without checking main thread idle time, which may impact performance. For more details on applying this option, refer to this link.
Collection methods
Instead of recording the actual screen or capturing it as an image, it collects DOM changes and CSS style information in text format. To avoid overhead, it only collects changes and transfers data when the browser's main thread is idle.
Applying the agent option
To apply the session replay feature, apply the browser agent option. See the following example:
<script>
  (function (w, h, _a, t, a, b) {
    w = w[a] = w[a] || {
      config: {
        projectAccessKey: {project_access_key},
        pcode: {pcode},
        sampleRate: 100,
        sessionReplaySampleRate: 50,
        sessionReplayMaskAllTexts: false,
        sessionReplayMaskAllInputs: false,
        proxyBaseUrl: "{proxy_base_url}",
      },
    };
    a = h.createElement(_a);
    a.async = 1;
    a.src = t;
    t = h.getElementsByTagName(_a)[0];
    t.parentNode.insertBefore(a, t);
  })(window, document, 'script', 'https://repo.whatap-browser-agent.io/rum/prod/v2/whatap-browser-agent.js', 'WhatapBrowserAgent', '');
</script>
-
sessionReplaySampleRate Number
The percentage of session replay collection during the entire collection session can be set from 0 to 100. For example, if
sampleRateis 100 andsessionReplaySampleRateis 50, only 50% of all sessions is recorded for the session replay.On the other hand, if
sampleRateis 50 andsessionReplaySampleRateis 100, 50% of all sessions is collected, and 100% of these is recorded for the session replay. -
sessionReplayMaskAllTexts Boolean
Default
trueIf you set the value to
false, all text data is collected without masking. -
sessionReplayMaskAllInputs Boolean
Default
trueIf you set the value to
false, the data in all input fields is collected without masking.
Exclusion of sensitive data collection
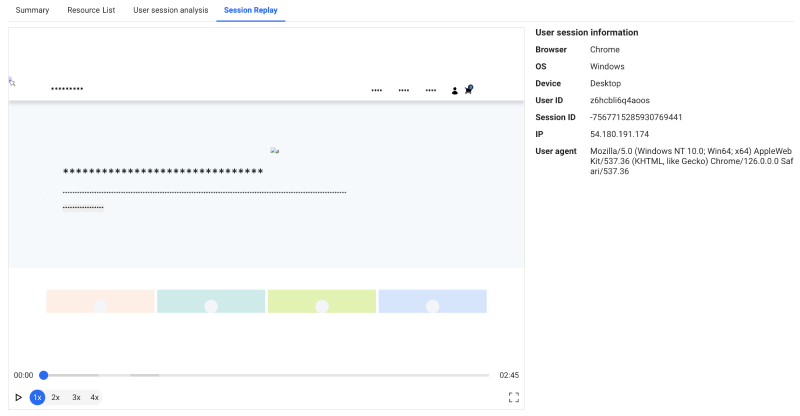
The default method to exclude collection of sensitive data is provided. All text data on the screen is masked and collected as follows: However, the value of sessionReplayMaskAllTexts in the agent options must be set to true.
Masking specific areas
In addition to text, it may contain personally identifiable information or sensitive data, and the option to mask specific areas is provided for protection.
| Masking for a specific area | In case masking is not applied |
|---|---|
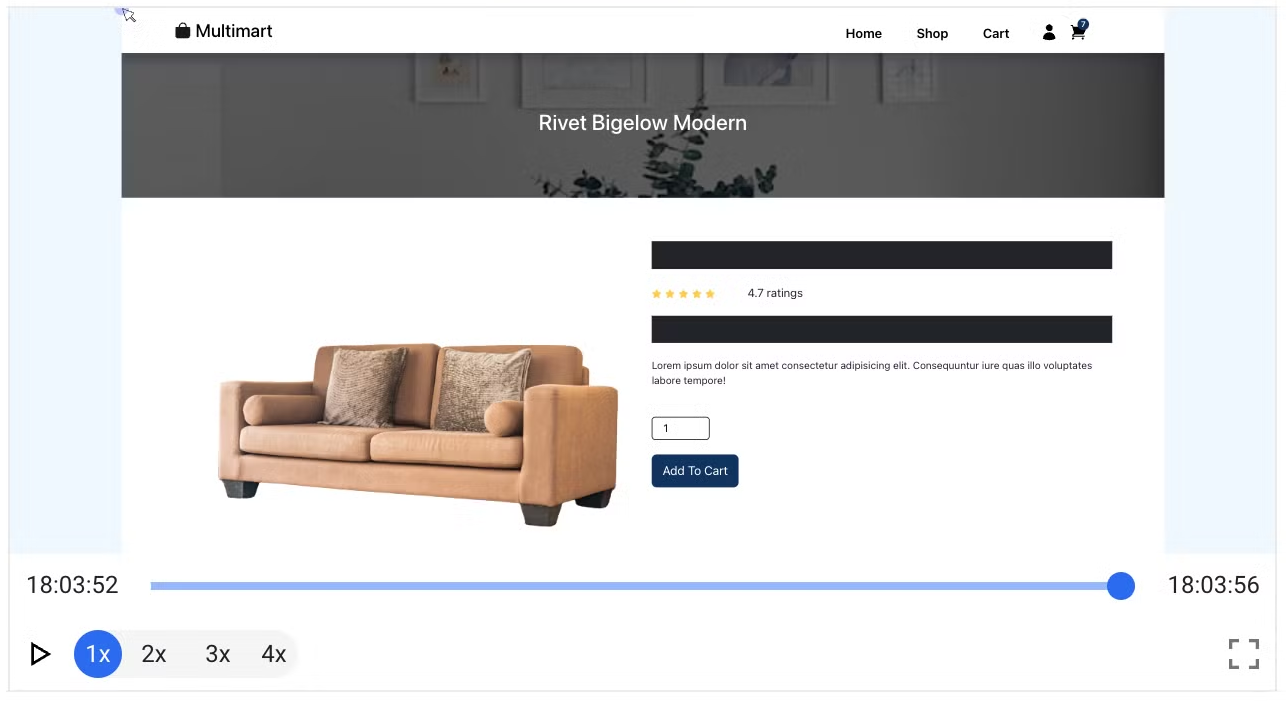 | 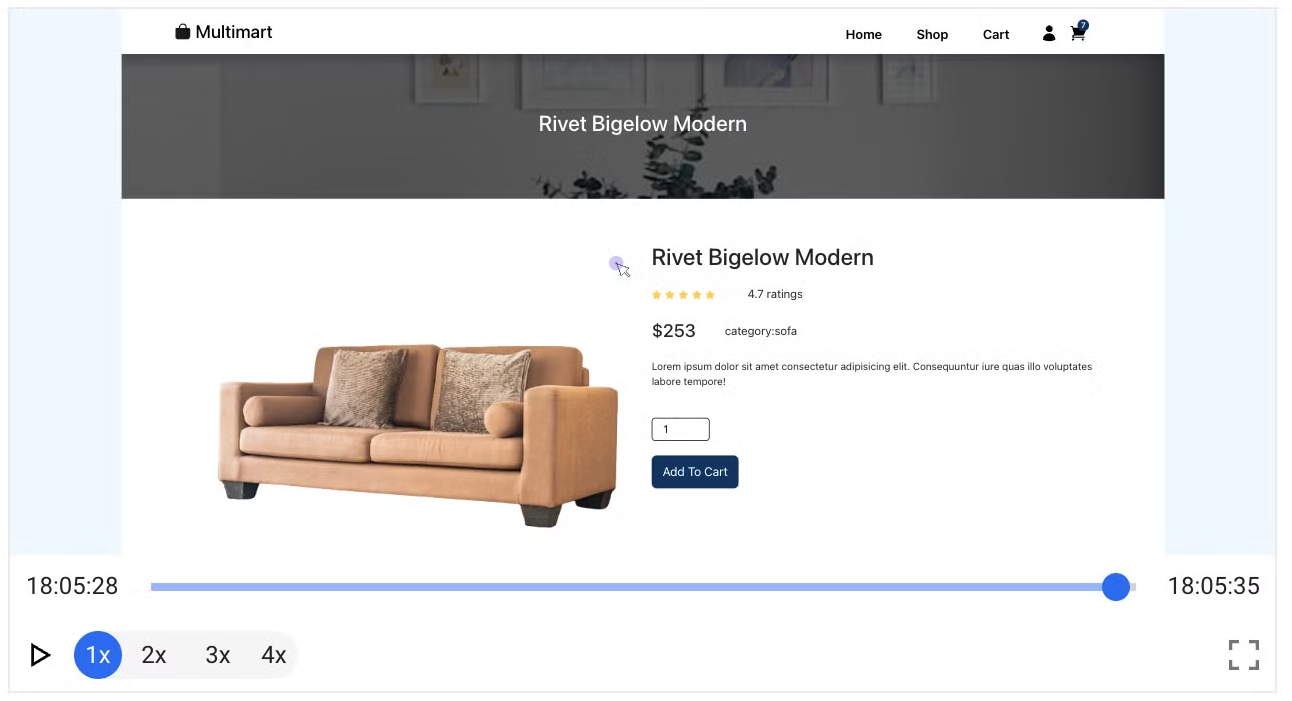 |
Add session-replay-block-class to the class name of the html element for the area to be excluded from collection. See the following example:
<div class="session-replay-block-class home-header pure-menu pure-menu-horizontal">
  <div class="home-header-bar">
    {% if site.data.archive %}
    <ul class="home-header-menu pure-menu-list">
      {% for item in site.data.archive %}
        <li class="pure-menu-item">
          <a href="{{ item.url | relative_url }}" class="pure-menu-link {% if page.url == item.url %}current-item{% endif %}"">{{ item.title }}</a>
        </li>
      {% endfor %}
    </ul>
    {% endif %}
  </div>
</div>
Masking specific text
If you set sessionReplayMaskAllTexts to false among agent options, most of the text appears, but it provides the option to exclude specific text areas from collection.
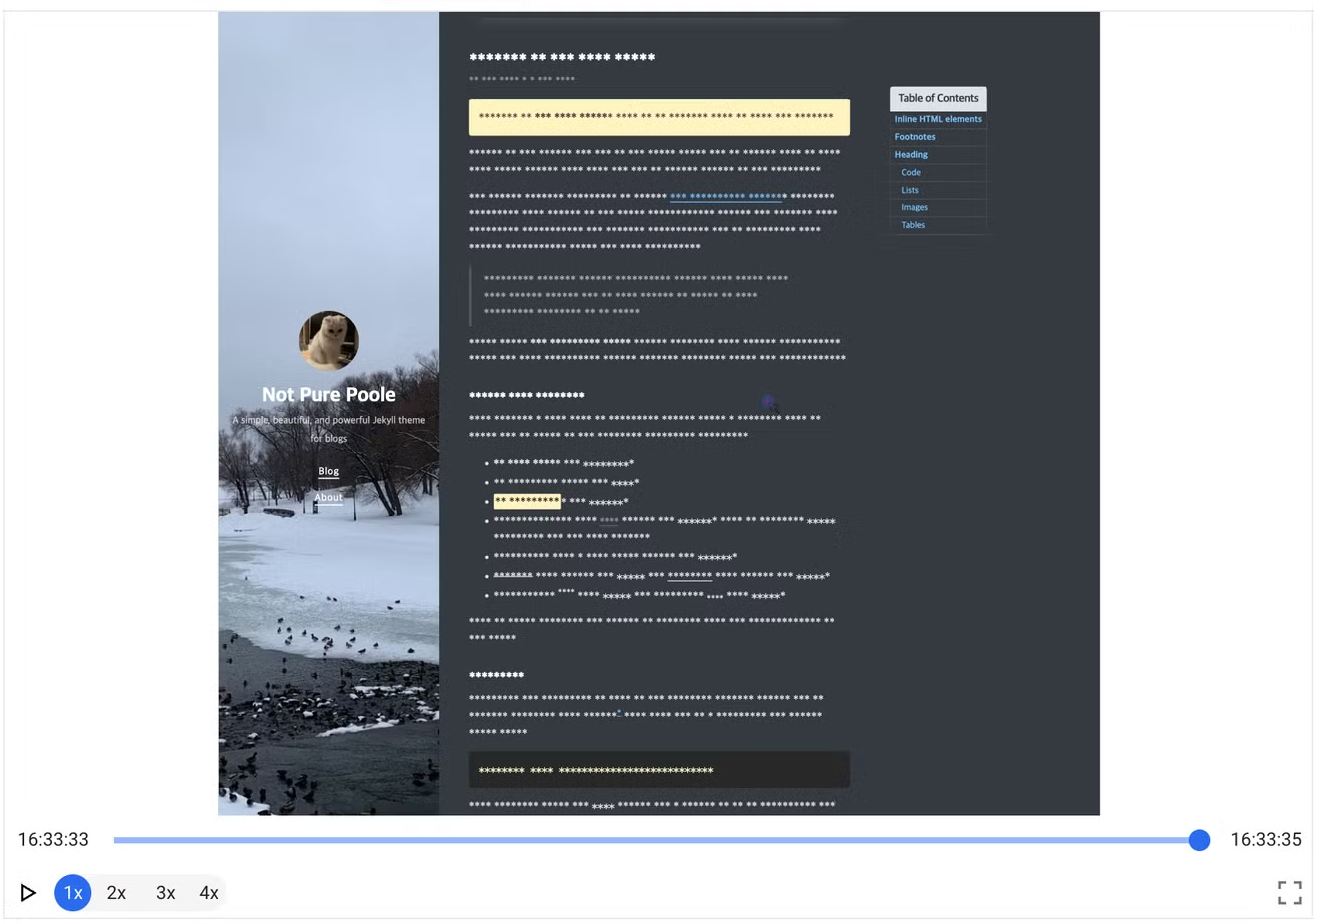
To exclude a specific text area from collection, add session-replay-mask-text-class to the class name of the HTML element. See the following example:
<main class="session-replay-mask-text-class">
{{ content }}
</main>
<footer class="footer">
{%- assign year_from = site.posts[-1].date | date: '%Y' -%}
{%- assign year_to = site.time | date: '%Y' -%}
{%- if year_from == nil or year_from == year_to -%}
{%- assign year_string = year_from -%}
{%- else -%}
{%- assign year_string = year_from | append: ' ' | append: '-' | append: ' ' | append: year_to -%}
{%- endif -%}
</footer>
Using the session replay
The Session replay feature can be used in the following menu path:
-
Analysis > Page Load Hitmap
-
Analysis > AJAX Hitmap
-
Analysis > User Session Log Search
The Session replay feature can be used by the members with the View log role. For more information about the member role scheme, see the following.
Page Load Hitmap
Analysis > Page Load Hitmap
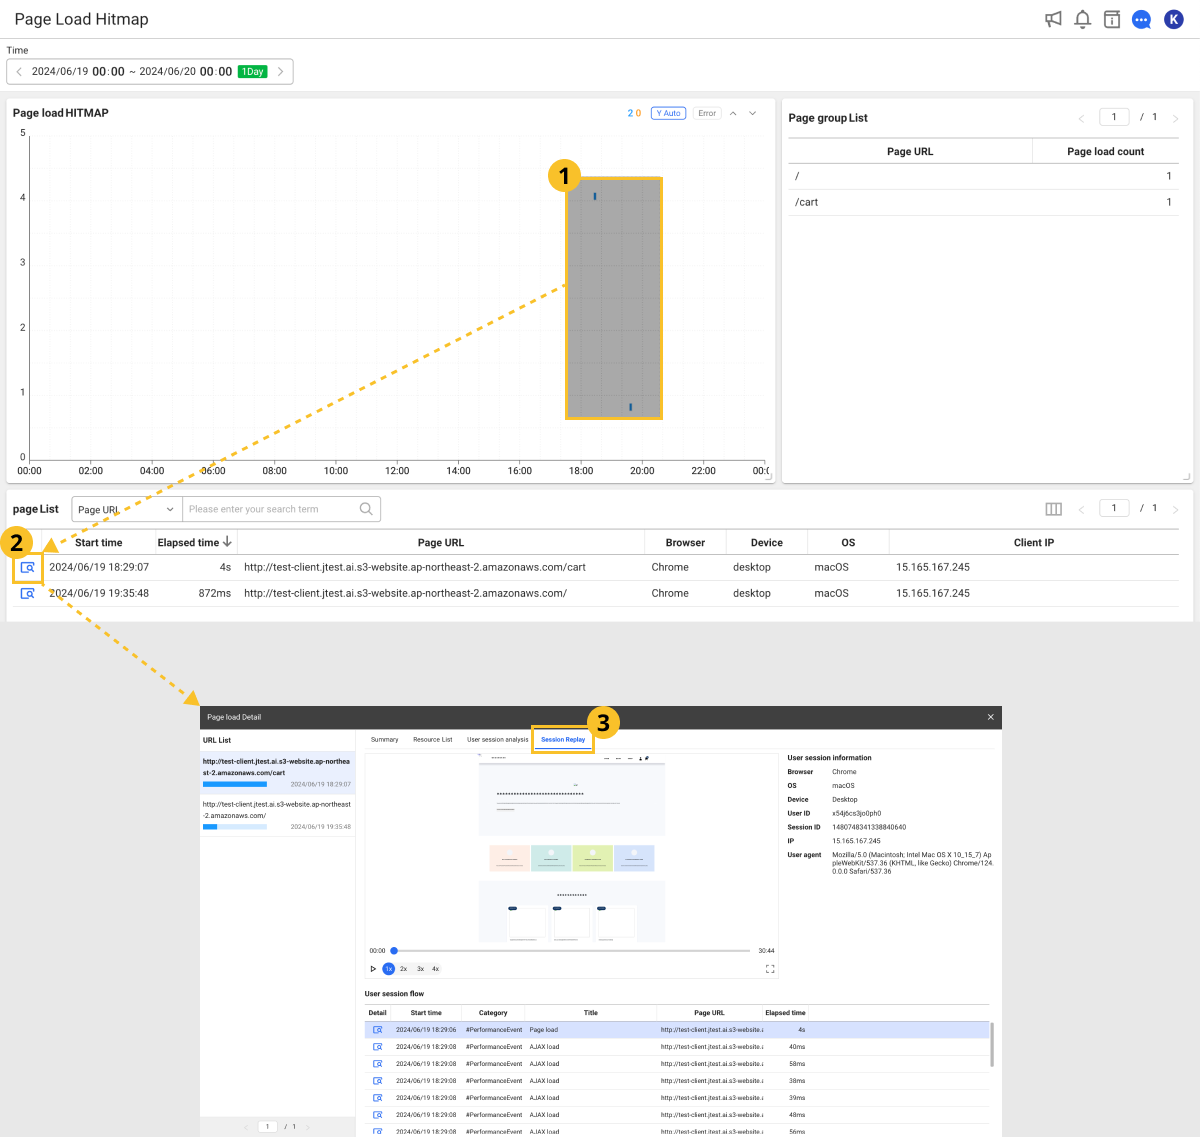
-
In the Page load Hitmap chart, drag a specific area.
-
In page List, select
 to check the Session replay feature.
 -
If the Page load Detail window appears, select the Session replay tab.
AJAX Hitmap
Analysis > AJAX Hitmap
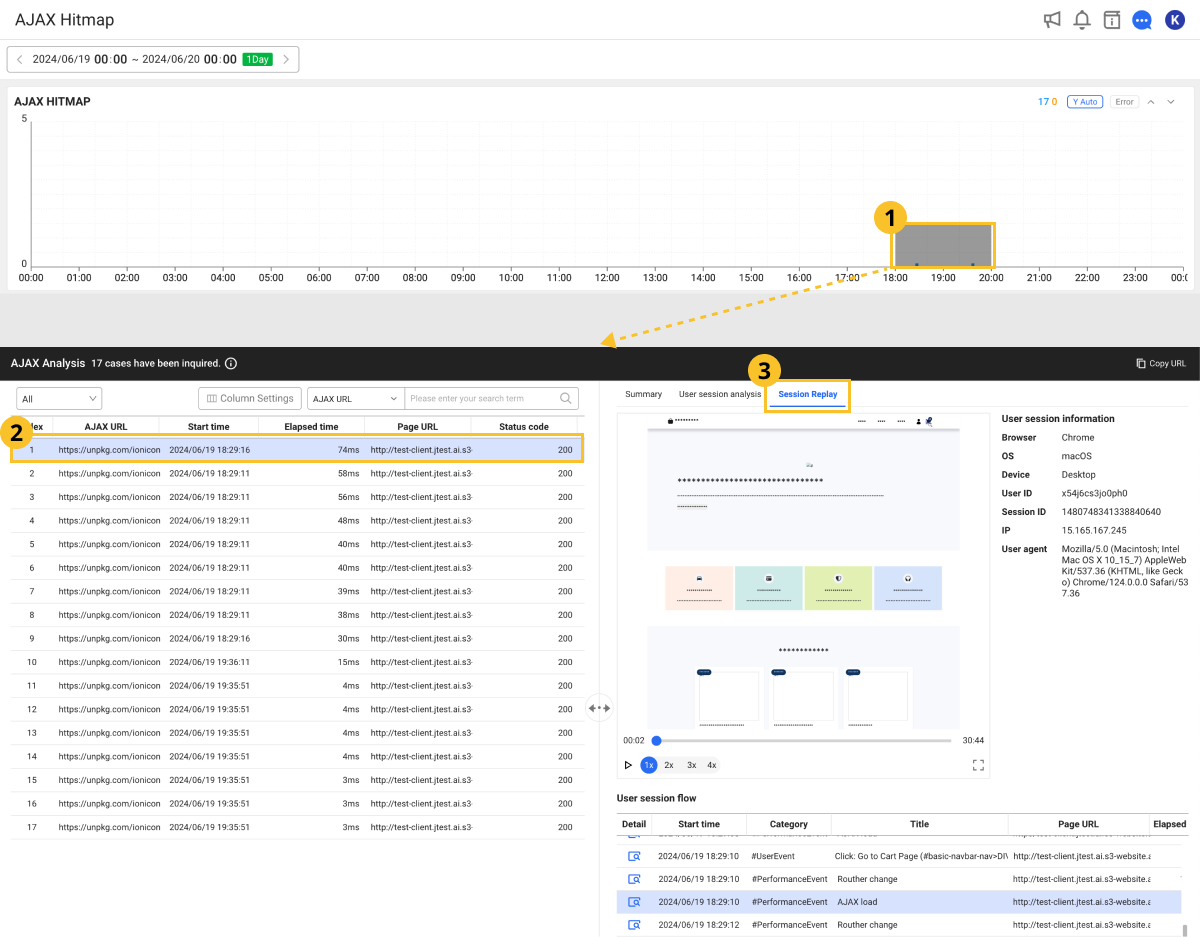
-
In the AJAX Hitmap chart, drag a specific area.
-
If the AJAX Analysis window appears, select an item from the list to check the Session replay feature.
-
On the screen to the right, select the Session replay tab.
User Session Log Search
Analysis > User Session Log Search
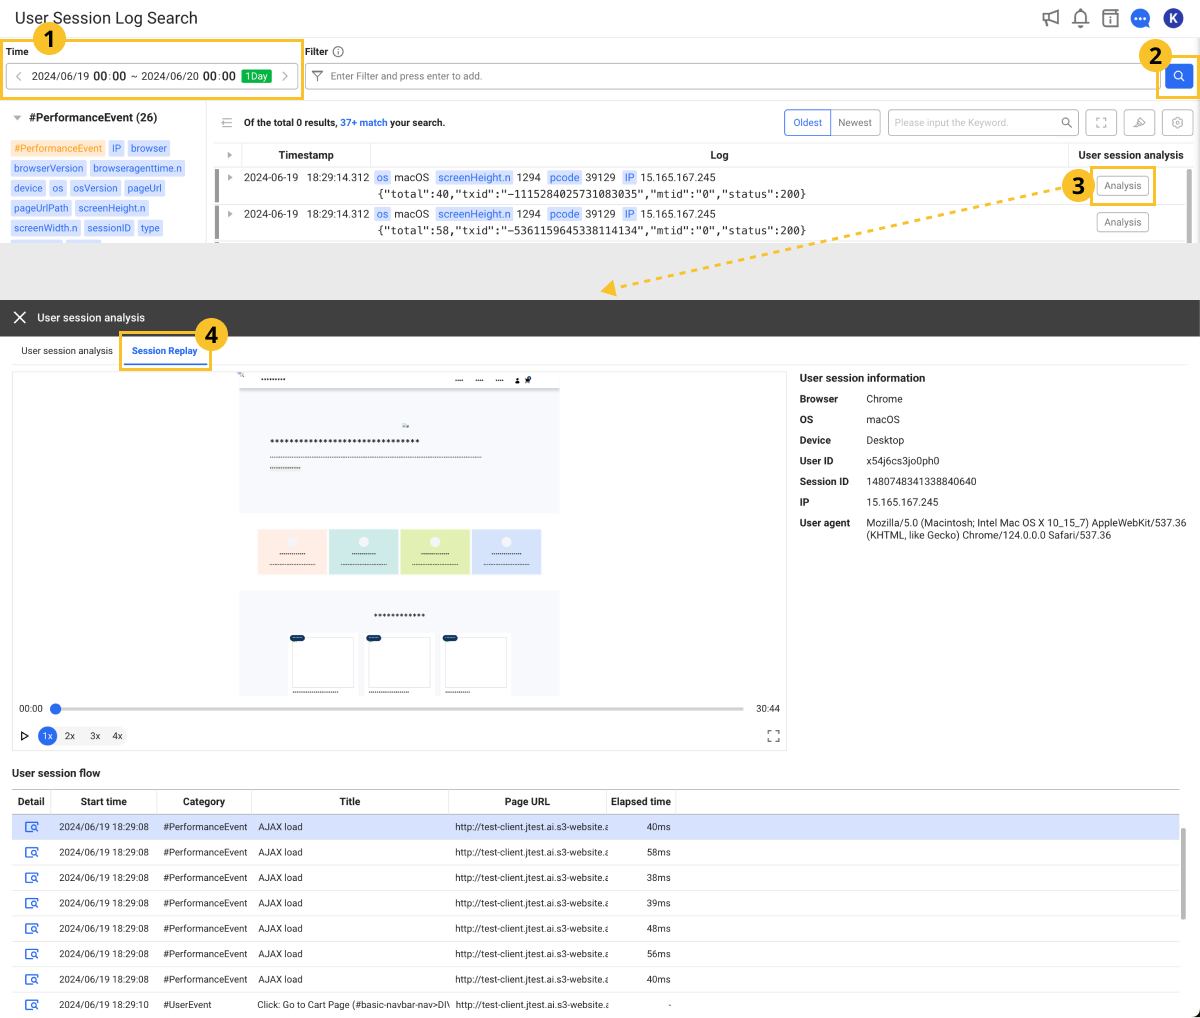
-
Set the time to search in Time.
-
On the right of the screen, select
 .
. -
In the list of search results, select Analysis on the utmost right of the item to check the Session replay feature.
-
If the User session analysis window appears, select the Session replay tab.
Using the session replay
Session replay player
You can replay the recorded user behavior events to see how actual users interact with the screen.
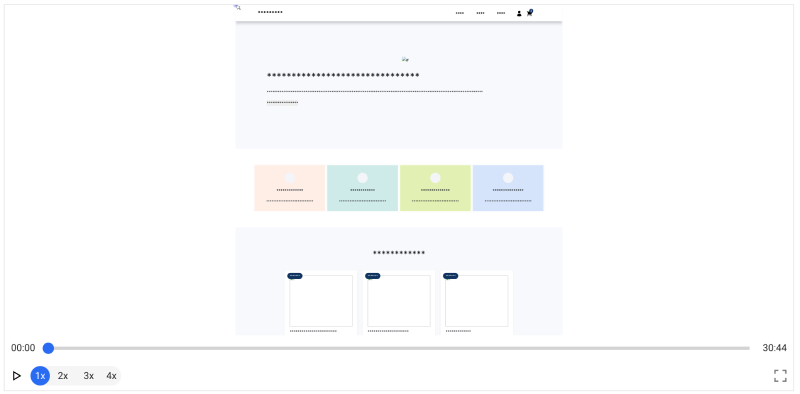
-
 /
/  : You can play or pause recorded user behavior events.
 -
1x / 2x / 3x / 4x: You can adjust the playback speed.
-
 : The player screen can be enlarged to full screen. To end the full screen, press the
 ESCkey. -
You can drag the timeline to move it to a desired location. The areas without mouse interaction are displayed in light gray.

User session information
On the right of the Session replay screen, you can see the actual user's session information.
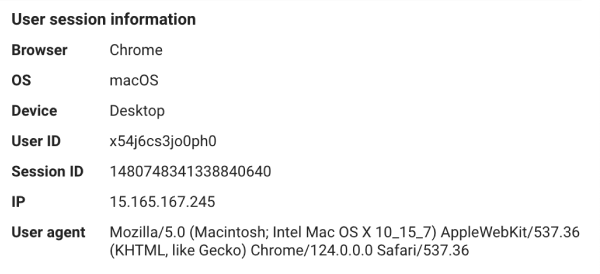
- Browser: Type of the browser of the end user.
- OS: OS type of the device used by the end user
- Device: Type of the device of the end user.
- User ID: Unique ID issued when an end user first accesses the web application
- Session ID: A unique ID issued when an end user of the web application begins browsing a web page.
- IP: IP address of the device used by the end user
- User agent: The user agent of the browser when an event occurred.
User session flow
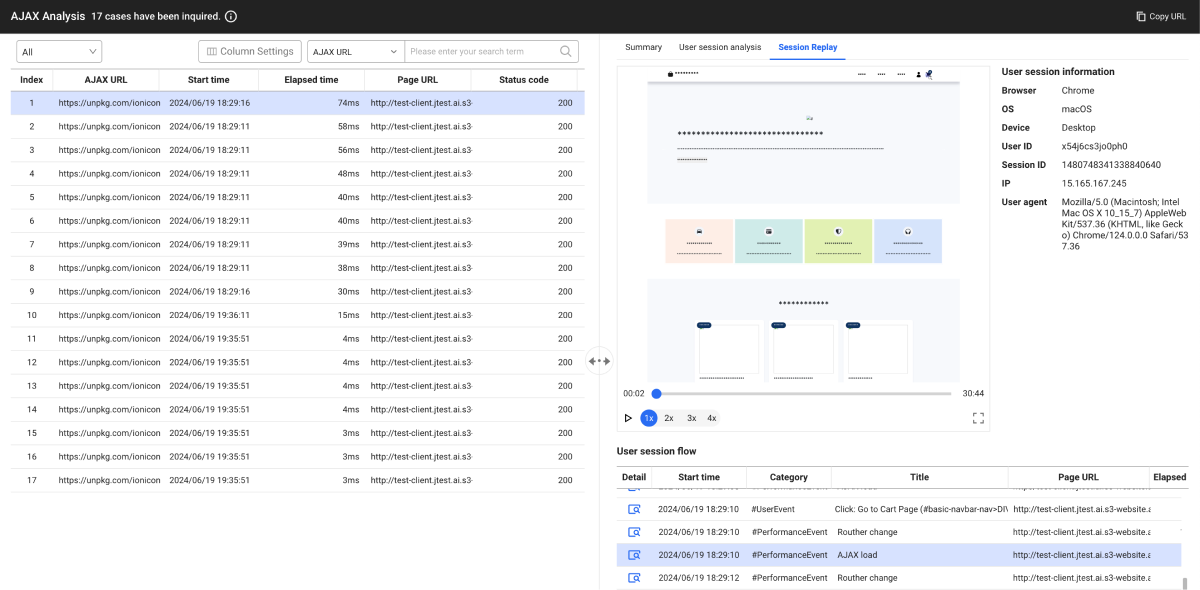
You can check the event records collected based on the start time. It is the same as the User session flow information shown in User session analysis.
-
If you select an individual event, the timeline of the Session Replay player is moved to the start point of the event.
-
To check the detailed information about an individual event, select
.
For more information about User session analysis, see the following.
AI Analysis
On the AI Analysis tab of the analysis panel, WhaTap AI reads the event flow of the whole session and tells you where the user got stuck. The result appears inside the panel instead of a drawer, so it does not cover the player.
-
Select the AI Analysis tab on the analysis panel.
-
Click the AI Analysis button in the middle of the tab.
-
The result is displayed as a stream.
-
Timestamps in the result are shown as links. Click a link to move the player timeline to that point.
-
Session logs are loaded progressively as playback advances, so the analysis runs against the logs loaded up to the moment you clicked the button.
-
Query string values in URLs, IP addresses, and user IDs are masked before being used for the analysis.
If the following message appears instead of the button, check the stated reason.
| Message | Description |
|---|---|
| Loading data | The session logs are still loading. The button appears once loading finishes. |
| No log collected. | No event was collected for the session. |
For how AI Analysis behaves in common and the data scope it uses, refer to the following document.