Resources
Home > Select Project > Dashboard > Resource
Widget charts are created by reprocessing resource data loaded by end users while using the web application. Resource dashboard is a real-time statistical data dashboard composed of these widgets. The load time of resources is an important user experience metric for web applications. The faster the resources are loaded, the more end users perceive the page to be available. The load time for resources is less than 800 ms that provides a better user experience. For more information about the resource load time, see the following.
-
On the upper right of each widget, select
. Then you can see the widget data in full screen.
-
If you select
on the upper right of the widget, the chart configuration screen appears. You can set the options to display on the chart.
-
Depending on the screen size of the web browser, the icon shape on the upper right of a widget may differ. If you select
, the additional icons appear.
-
For more information about the widget configuration, see the following.
-
For more information on how to use the time selector, see the following.
Resource Count

You can check the resource load count in real time. On the upper right of the widget, select and then set the time zone to see the resource load count. To change the data query criteria to Resource Host or All resources, select Resource Path on the upper right of the widget.
Average 1st Party Resource Response Time

This widget analyzes the resource host and provides the average response time of resources called by the 1st party with a chart.
-
To change the data query criteria to Resource Host or All resources, select Resource Path on the upper right of the widget.
-
When viewed based on the Resource Path and Resource Host, the average resource response time and count for the top 10 resources are provided.
-
You can identify resources that take a long average response time by specific paths and hosts.
-
On the upper right of the widget, select
and then set the time zone to see the resource response time.
Average 3rd Party Resource Response Time

This widget analyzes the resource host and provides the average response time of resources called by the 3rd party with a chart.
-
To change the data query criteria to Resource Host or All resources, select Resource Path on the upper right of the widget.
-
When viewed based on the Resource Path and Resource Host, the average resource response time and count for the top 10 resources are provided.
-
You can identify resources that take a long average response time by specific paths and hosts.
-
On the upper right of the widget, select
and then set the time zone to see the resource response time.
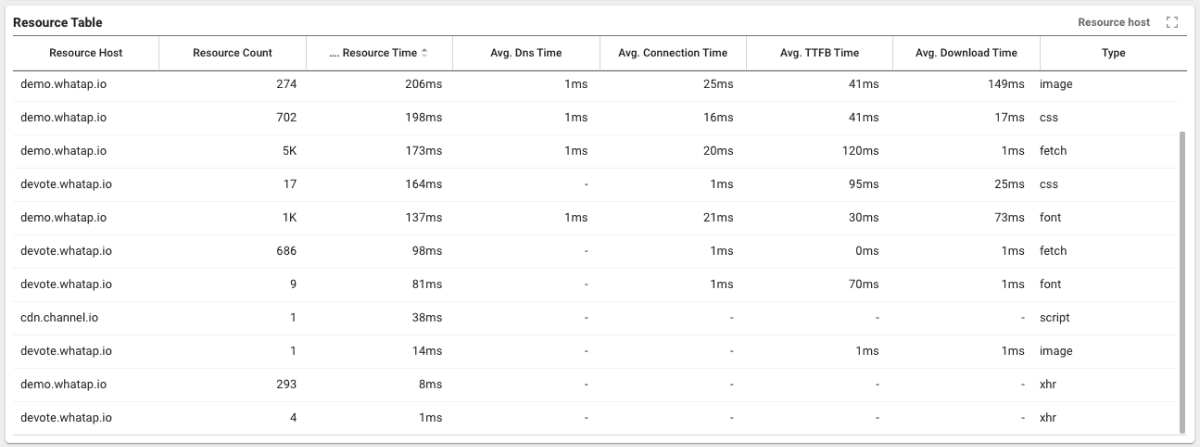
Resource Table

You can identify resources that take longer to respond and see where the delay occurs. To change the data query criteria to Resource Host or All resources, select Resource Path on the upper right of the widget.
-
Avg. Dns Time: Average DNS lookup time for resources.
-
Avg. Connection Time: Average time taken to connect the server providing resources.
-
Avg. TTFB Time: Average time from connecting to the server to receiving the first byte of the resource.
-
Avg. Download Time: Average elapsed time to download resources.
-
type: Resource type.