Report
Home > Select Project > Report
If you click ![]() in Report on the screen, you can see various analysis reports classified by daily, weekly, and monthly. Select a desired report format, and then set the date and time to view and filtering options. You can check the selected report by selecting
in Report on the screen, you can see various analysis reports classified by daily, weekly, and monthly. Select a desired report format, and then set the date and time to view and filtering options. You can check the selected report by selecting ![]() .
.
Report is a document that reports the service usage status and failure records for individual projects. The persons in charge of service monitoring share the status report with the people of related departments.
The monitoring data analysis is important because it serves as a metric for determining the direction of improvement. However, it is cumbersome to aggregate and document data from multiple dashboards.
WhaTap's Report menu supports automated report creation. Through the Report menu, you can create weekly reports, share reports at the set times, and manage various templates.
To download, print, or schedule to send reports or emails, click the button. Downloading is available in HTML format.
Daily browser report
Using the daily browser report, you can see the web page usage of the day. Set the start date, start time, and end time, and then select ![]() . A report is divided into the following.
. A report is divided into the following.
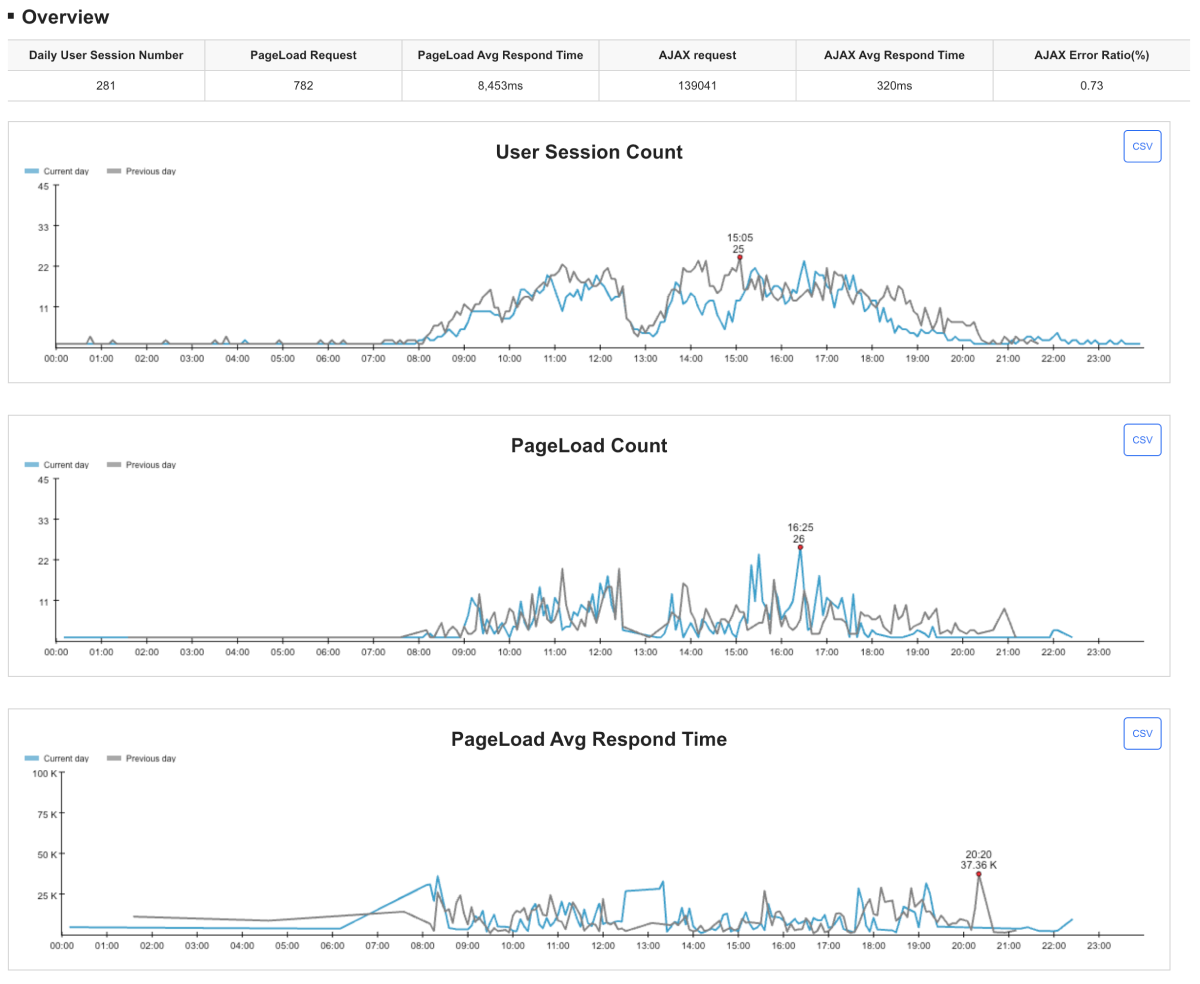
Summary
The web page access performance during the inquiry period can be checked briefly through the figures and charts.
-
Unique user sessions: Number of user sessions during the inquiry period.
-
Page load count: Number of page loads during the inquiry period.
-
Average page load response time: Average of all the page load times during the inquiry period.
-
AJAX request count: Number of AJAX requests during the inquiry period.
-
AJAX average response time: Average of all AJAX response times during the inquiry period.
-
AJAX error rate: Ratio of the total AJAX request count divided by the AJAX error count.
-
Chart: unique user sessions, Page load count, Page load average response time
You can see the changes of key metrics over time through the graph and quickly find the time and figure at which each metric was the highest. On the upper right of the chart, select CSV to download the data in a CSV file format.
Top 10 page loads for each browser
You can see the top 10 most used browsers of the day. The page load count and average response time appear.
Top 10 page loads for each region
You can see the top 10 most accessed regions of the day. The page load count and average response time appear.
Currently, only the regions accessed from South Korea are displayed.
Top 10 page loads
You can see the top 10 page groups that generated the highest page loads during the day. The page load count for each page and average response time appear.
Top 10 router changes
The router change event occurs when web pages are switched in the form of Client Side Rendering (CSR). You can see the top 10 page page groups that generated the page loads frequently during the day. The page switching count to the page and average response time appear.
Top 10 AJAX calls
You can see the top 10 AJAX calls during the day based on the AJAX path. The AJAX call count and average response time appear.
Top 10 1st resource call counts
Among the resources called by hosts such as web pages, you can see the top 10 resource calls during the day based on the resource path. Excluding AJAX calls, it displays the resource call count together with the average response time.
Top 10 3rd resource call counts
Among the resources called from the hosts other than web pages, you can see the top 10 resource calls during the day based on the resource path. Excluding AJAX calls, it displays the resource call count together with the average response time.
Top 10 error counts by page
For the number of errors during the day, you can see the top 10 page groups classified by the page group.
Top 10 error counts by error message
The error messages are values that can identify errors in the browser. For the number of errors during the day, you can see the top 10 error messages classified by the error message.
Top 10 AJAX errors
For the AJAX error count during the day, you can see the top 10 AJAX paths classified by the AJAX path.
Recreating a report
Select Reset to refresh the data in the report. To search the data for a different date or time, set the start date, start time, and end time and then select Reset or ![]() .
.
Downloading or printing the report
-
Download: You can download the report as an HTML file. The file name is saved in the format of DailyBrowserReport_
yyyymmdd.html. -
Print: You can save or print the report as a PDF file. To save as a PDF file, select Save as PDF for the target to print.
NoteThe function to save as a PDF file may not be supported depending on the web browser.
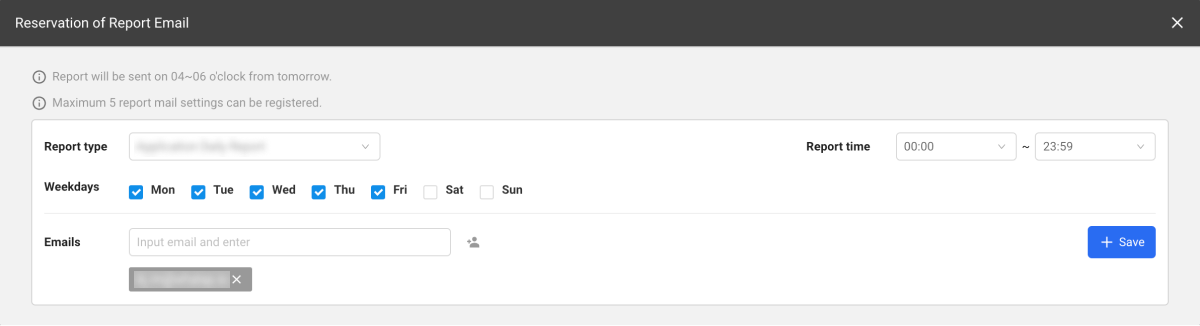
Email delivery schedule
To receive regular reports by email, select Reservation of Report Email. You can replace various service checking tasks performed right after work with email confirmation.