IP Load Statistics
Home > Select Project > Statistics > IP Load Statistics
The IP Load Statistics menu provides load performance information for each IP address connected to the website. This allows you to check IP addresses with poor performance and identify IP addresses that require improvement. It provides statistical information based on the average, maximum, minimum, and percentile values. It also filters and analyzes the time data in detail during page loading for each IP address by using the navigation timing data.
IP load time is the total time taken for a specific IP from loading all resources (CSS, JS, images, fonts, etc.) of the website to rendering all contents. To collect this data, the browser agent uses the Navigation Timing API that is a web API provided by the browser.
For more information about the data collected in IP Load Statistics, see the following.
Basic usage guide
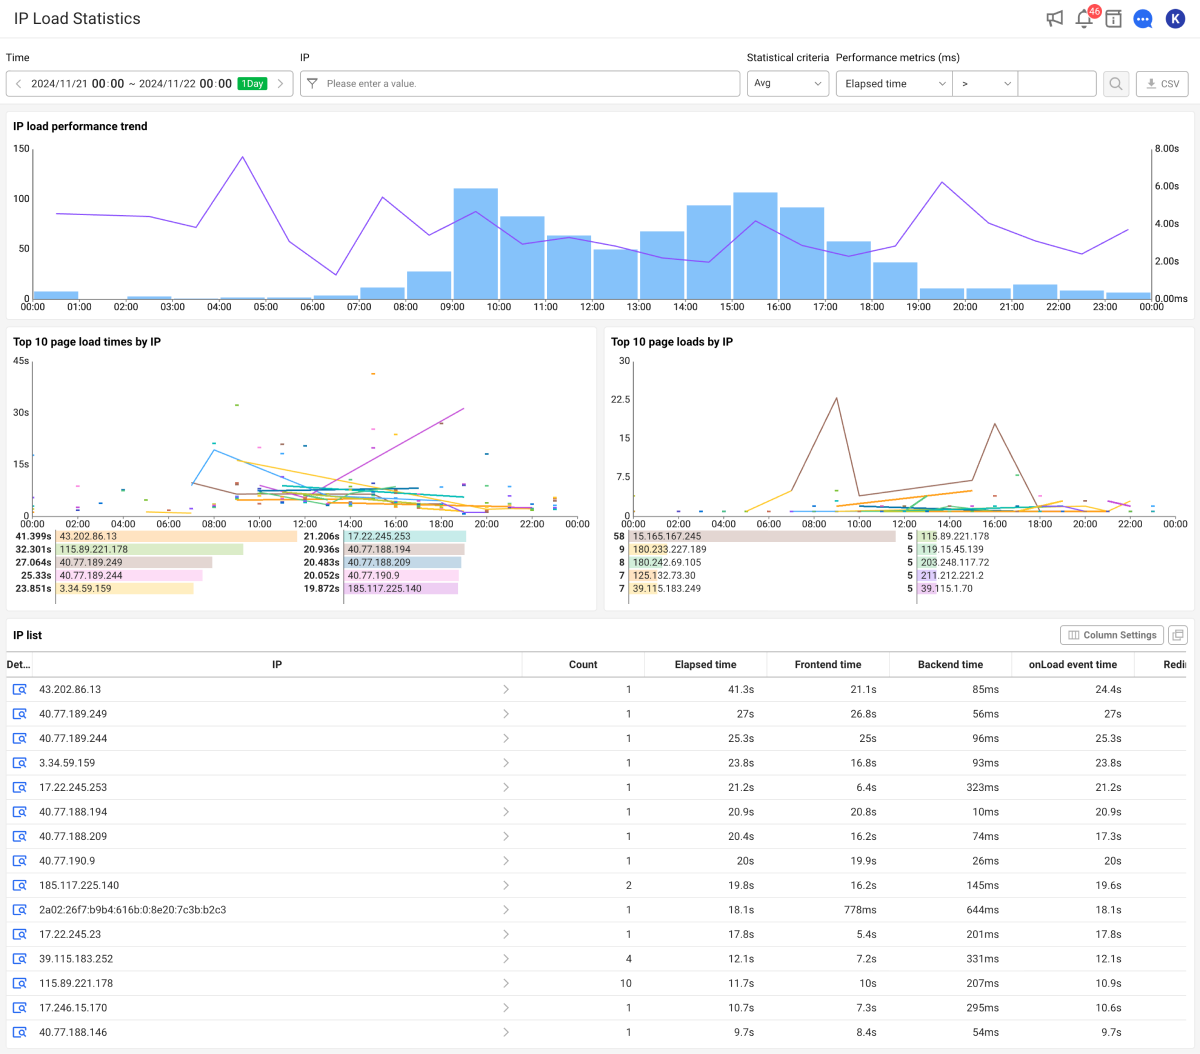
It provides performance metrics for each page accessed from a specific IP address. For each IP address, you can see various performance metrics such as IP load time, DOM load time, network delay time, and resource load time. This allows you to evaluate the performance of each IP address and determine whether it has been optimized.
-
Set the date and time to view the performance metrics in Time.
-
Select the desired criteria in Statistical criteria.
-
Select
on the upper right of the screen.
You can see the performance metrics of the time range searched for through graph charts and lists in each section. If you hover the mouse over the graph chart in each section, the metric information for the time zone appears.
For more information about Statistical criteria, see the following.
Setting the lookup time
Set the date and time to view the performance metrics in Time.
-
The maximum time you can select is 3 days, and the minimum selectable time is 5 minutes.
-
If you select a range of 2 hours or less, data is retrieved every 5 minutes. If it exceeds 2 hours, data is retrieved every 1 hour.
-
For more information on how to use the Time option, see the following.
Selecting the statistical criteria
Statistical criteria is an option that allows users to check the statistical metrics to analyze based on the following selection criteria:
-
Avg: It provides statistics by calculating the average load times for each IP address.
-
Max: It provides statistics based on the maximum load times for each IP address. It indicates that you can identify which IP address has the most inefficient page load time.
-
Min: It provides statistics based on the minimum load times for each IP address. This allows you to identify which IP address has been loaded under the most optimal conditions. It is useful when setting the performance optimization goals.
-
percentile: It provides statistics of the load times for each IP address percentile.
-
95quantile: It is the slowest 5% of IP load times, which represents the experience of the top 5% of users who experienced the slowest IP load times.
-
90quantile: It corresponds to the slowest 10% of IP load time, and is useful to identify performance issues primarily among slow user group.
-
75quantile: It displays the top 25% of IP load times that are slower than the bottom 75%.
-
50quantile: The median means that half of all IP addresses loaded the page faster than the time, and half of them loaded the page slower.
-
-
Avg is useful for getting an overall performance status, but it can be difficult to detect cases where performance degradation occurs intermittently. At this time, by using the Max and percentile options together, you can check the time when the performance degradation occurred and how severe it was.
-
Min can be used as a reference when setting the performance optimization goals or evaluating how effective a specific optimization is. However, because it is difficult to evaluate the consistency of performance with this value alone, it is recommended to analyze the statistical data together with the Avg or percentile option.
-
The percentile option is ideal for analyzing performance data at a more precise level than simple averages, providing valuable data for improving user experience. This option allows you to identify the percentage of users experiencing performance degradation and effectively select the target pages to optimize.
Downloading the viewed result
You can download the searched data as a CSV format file. Select on the upper right of the screen. The format of the CSV file name is IP_LoadStatistics_
YYYYMMDD_HHMMSS.csv.
Screen layout
IP load performance trend
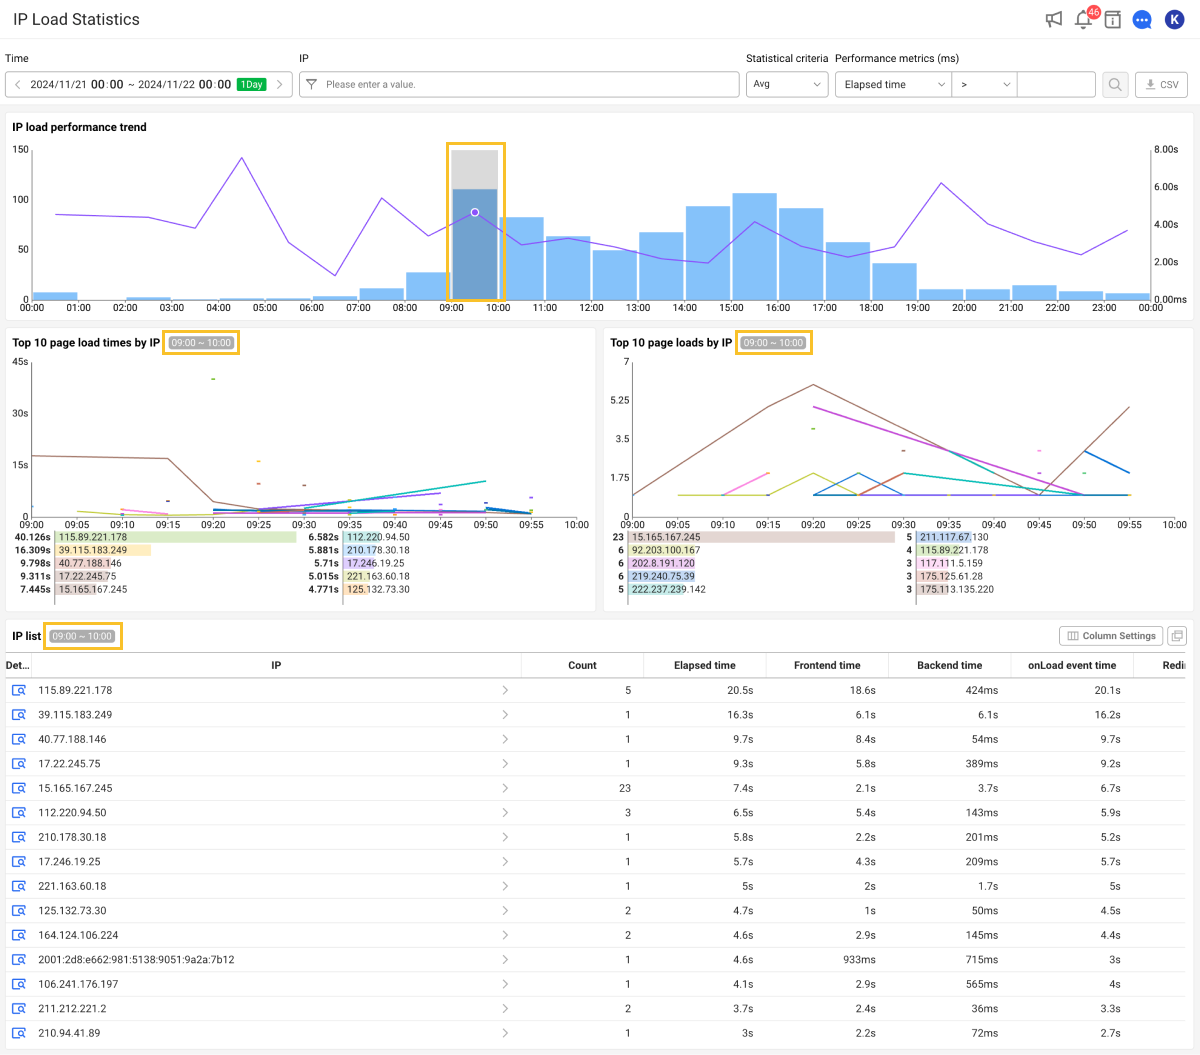
It is the IP load performance trend chart over time. This graph allows you to see if there have been any performance fluctuations over a specific period.
-
If you select the blue bar graph for a specific time, the data can be viewed in the Top 10 page load times, Top 10 page load counts, IP list sections for the selected time range.
-
Depending on the options selected in Statistical criteria, the items displayed in the chart are changed.
Statistical criteria: Avg/Max/Min

-
The blue bar graph is the number of pages loaded for a specific time zone.
-
The purple line graph is the average page loading time for the time zone.
Statistical criteria: percentile

-
Blue represents 50quantile, purple 75quantile, orange 90quantile, and green 95quantile.
-
The blue bar graph is the number of pages loaded for a specific time zone.
Top 10 page load times by IP
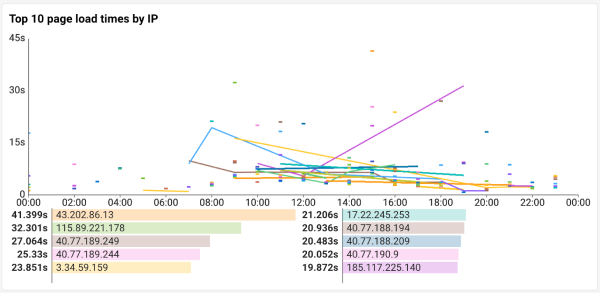
IP addresses are grouped by 5-minute or 1-hour intervals and the top 10 IP groups with the longest page load times per unit are displayed in a time series graph. This graph displays the IP addresses sorted in descending order of the page load time.
-
The bar chart at the bottom of the section displays the average values for each IP address in the time series graph.
-
If Statistical criteria is Avg or Max, Min, the elapsed time is expressed with the selected reference value.
-
If Statistical criteria is percentile, the elapsed time is expressed as 95quantile.
-
If data is not collected in continuous time intervals but exists only in specific intervals, a bar graph is displayed only.
Top 10 page load counts by IP
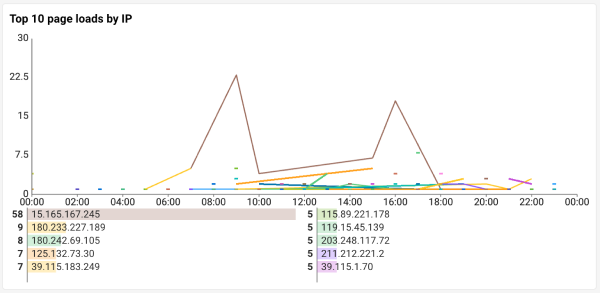
IP addresses are grouped by 5-minute or 1-hour intervals and the top 10 IP groups with the greatest page load counts per unit are displayed in a time series graph. This graph displays the IP addresses sorted in descending order of the page load count.
-
The bar chart at the bottom of the section displays the sum values for each page group in the time series graph.
-
If data is not collected in continuous time intervals but exists only in specific intervals, a bar graph is displayed only.
IP list
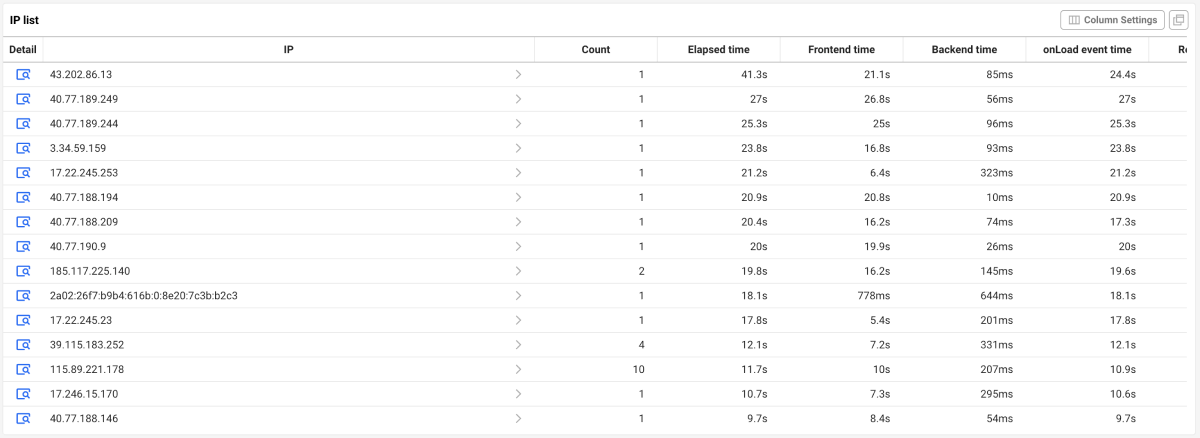
It is a list where you can check various performance metrics based on the IP group.
-
If you select Statistical criteria as percentile, you can additionally check the number of cases for each IP group and the elapsed time for 50quantile, 75quantile, 90quantile, and 95quantile.
-
When you select
Detail on the utmost left of the list, the IP load statistics detail page screen appears. You can check detailed statistical information of the selected IP group through the IP load statistics detail page screen. For more information, see the following.
-
You can go to the User Session Log Search menu by selecting
in the IP column. You can check the results by applying the selected page group URL and query time as filters.
-
Column Settings: You can hide the table header columns or add desired items. You can also change the column order. For more information, see the following.
-
When you move from the IP Load Statistics menu to the User Session Log Search menu, the data before and after the specific time range may also be included.
-
View for 2 hours or more: Data is searched every 1 hour, with 1 hour added before and after the query time range.
For example, if you search for 3 hours from 11:00 to 14:00 on October 21, 2024, the actual search range is extended to 5 hours from 10:00 to 15:00 on October 21, 2024.
-
Query within 2 hours: Data is retrieved every 5 minutes, with 5 minutes added before and after the query time range.
For example, if you search for 30 minutes from 11:00 to 11:30 on October 21, 2024, the actual search range is extended to 40 minutes from 10:55 to 11:35 on October 21, 2024.
-
-
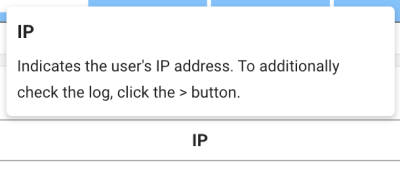
If you hover your mouse over a column header in the table, the detailed information about the column is provided in a tooltip format. For more information about column entries, see the following.
IP load statistics detail page
You can check detailed statistical information of the selected IP group.
-
IP load timeline

It provides the overall IP loading performance information for the web applications. It displays the page load times and the average times for each load step. You can see the overall performance of your browser applications through this. For more information, see the following.
NoteIf Statistical criteria is percentile, the IP load performance is displayed as a percentage. Blue represents 50quantile, purple 75quantile, orange 90quantile, and green 95quantile.
-
Page load times by IP

You can check the page load time over time for the selected IP group. You can select various performance metrics from the selection box. For more information about the performance metrics, see the following.
NoteIf Statistical criteria is percentile, the IP load times for each percentile are provided.
-
Page load counts by IP

You can check the page load count over time for the selected IP group.
-
IP list

It is a list of tables that provide a quick overview of various performance metrics based on the IP address. You can go to the User Session Log Search menu by selecting
in the IP list column. You can check the results by applying the selected IP address and query time as filters.
Note-
When you move from the IP list menu to the User Session Log Search menu, the data before and after the specific time range may also be included.
-
View for 2 hours or more: Data is searched every 1 hour, with 1 hour added before and after the query time range.
For example, if you search for 3 hours from 11:00 to 14:00 on October 21, 2024, the actual search range is extended to 5 hours from 10:00 to 15:00 on October 21, 2024.
-
Query within 2 hours: Data is retrieved every 5 minutes, with 5 minutes added before and after the query time range.
For example, if you search for 30 minutes from 11:00 to 11:30 on October 21, 2024, the actual search range is extended to 40 minutes from 10:55 to 11:35 on October 21, 2024.
-
-
If you hover your mouse over a column header in the table, the detailed information about the column is provided in a tooltip format. For more information about column entries, see the following.

-
-
Data collection restrictions
-
The list of up to 5,000 page URL paths are generated every 5 minutes and it is sent to the server.
-
If the number of unique URL paths exceeds 5,000 for 5 minutes, additional data is ignored.
-
-
Data accuracy
Navigation Timing API may collect some detailed time information as 0. This may cause some performance metrics not to be displayed.
-
Charting interval
The chart interval is determined by the time unit of the data being viewed.
-
If you query with 1-hour data, the chart interval is displayed as 1 hour.
-
If you query with 5-minute data, the chart interval is displayed as 5 minutes.
-
Filtering the searched results
You can filter the retrieved statistical data based on IP or Performance metrics (ms) to focus on analyzing the desired content.
IP address filter
You can select a specific IP address to view its performance data. Select a desired IP group in the IP option.
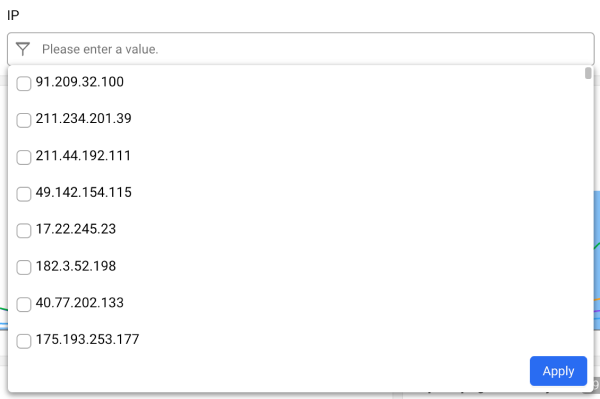
You can select up to 3 IP addresses.
Performance metrics filters
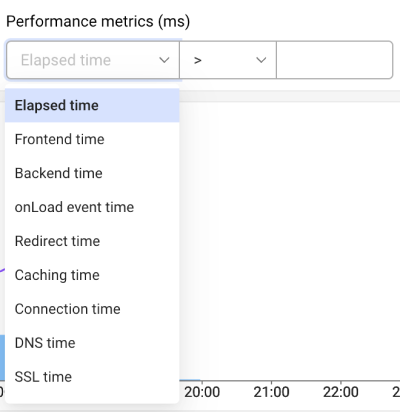
Performance metrics include the page load time, redirection time, download time, and such. You can perform query by applying thresholds to various performance metrics. Select the desired metrics from the Performance metrics (ms) option, and then apply the thresholds and operator conditions.
-
Operators:
>(greater than),>=(greater than or equal to),<(less than),<=(less than or equal to),==(equal to) -
You can enter a positive number, negative number, or 0 as the threshold, but whether to enter a negative number may differ depending on the selected performance metrics.
-
You can apply filters and search for a single performance metric.
For more information about the performance metrics that can be selected, see the following.
Setting columns
You can hide table header columns or add desired items in Page group list. You can also change the column order. Select Column Settings.
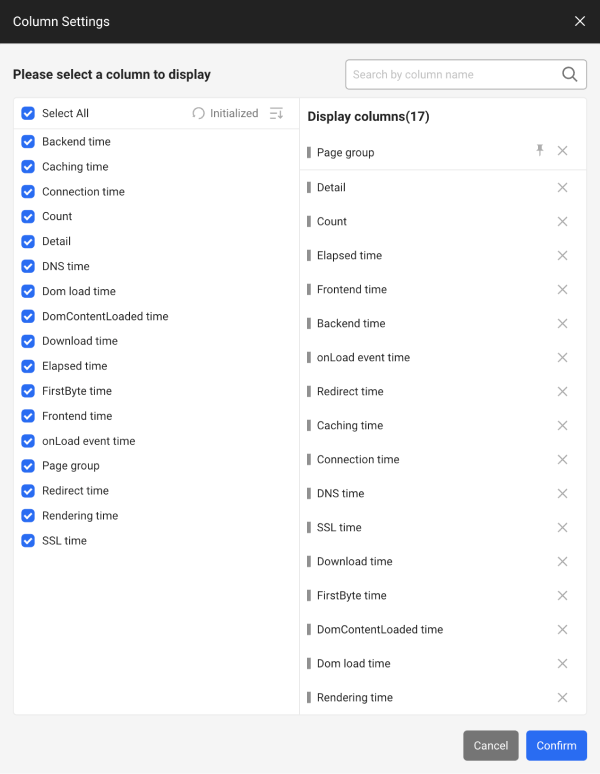
To sort the list on the left in ascending or descending order, select the /
button.
Adding columns
-
Select columns to add from the list on the left.
-
Check that the selected columns are added to the list on the right.
-
Once you have added all the desired columns, select Confirm.
-
To select all columns, click Select all at the top of the list on the left.
-
For more information about column entries, see the following.
Deleting columns
-
Select
on the right of the column to delete from the list on the right.
-
Make sure the checkboxes for the deleted columns are unchecked in the list on the left.
-
Once you have deleted all the desired columns, select Confirm.
Changing the column order
The following features allow you to change the order of columns or fix the desired items.
-
You can change the order of the columns by dragging items to change in the list on the right to the desired positions.
-
Select
on the right of a column entry. The selected column is fixed on the top. The fixed columns are fixed to the utmost left in the table list.
After all settings are finished, selectConfirm.
Initializing the column settings
To cancel all changes and reset them, select Initialized. Select Confirm to reflect the initialized settings.
Guide to the columns and terms
| Columns | Unit | Description |
|---|---|---|
| Backend time | millisecond | Time taken for the backend to process a page load from the IP address. (Time from startTime to responseEnd) |
| Frontend time | millisecond | Processing time of the frontend area while loading a page from the IP address. (Time from domInteractive to loadEventEnd) |
| Redirect time | millisecond | Time taken for redirection to load a web page from the IP address. (Time from redirectStart to redirectEnd) |
| Caching time | millisecond | Time taken to retrieve a cached resource from a given IP address. (Time from fetchStart to domainLookupStart) |
| DNS time | millisecond | Time taken to view a website domain from the IP address. (Time from domainLookupStart to domainLookupEnd) |
| Server connection time | millisecond | Time taken for the network connection between the client requesting the IP and the server. |
| SSL time | millisecond | Time taken for TLS handshaking when connecting to HTTPS. (Time from connectEnd to secureConnectionStart) |
| FirstByte time | millisecond | Time taken to receive the first byte from the server after an IP request. (Time from requestStart to responseStart) |
| Download time | millisecond | Time taken to download the IP-related resources from the server. (Time from responseStart to responseEnd) |
| DomContentLoaded time | millisecond | Time taken for the initial content rendering from the IP address. |
| Dom load time | millisecond | Time taken for all resources to load and fully render in the state where the end users can interact with them. |
| Rendering time | millisecond | Time taken to load a page from the IP address, render on screen, and complete the page event. |
| onLoad event time | millisecond | Time taken to load a page from the IP address until the onLoad event occurs. It indicates the time from retrieving the IP address and establishing a network connection until all resources are loaded. |
| Elapsed time | millisecond | Total time taken to fully load a page from the IP address. |
For more information about Navigation timing, see the following.