Browser Monitoring Dashboard
Home > Select Project > Dashboard > Browser Monitoring Dashboard
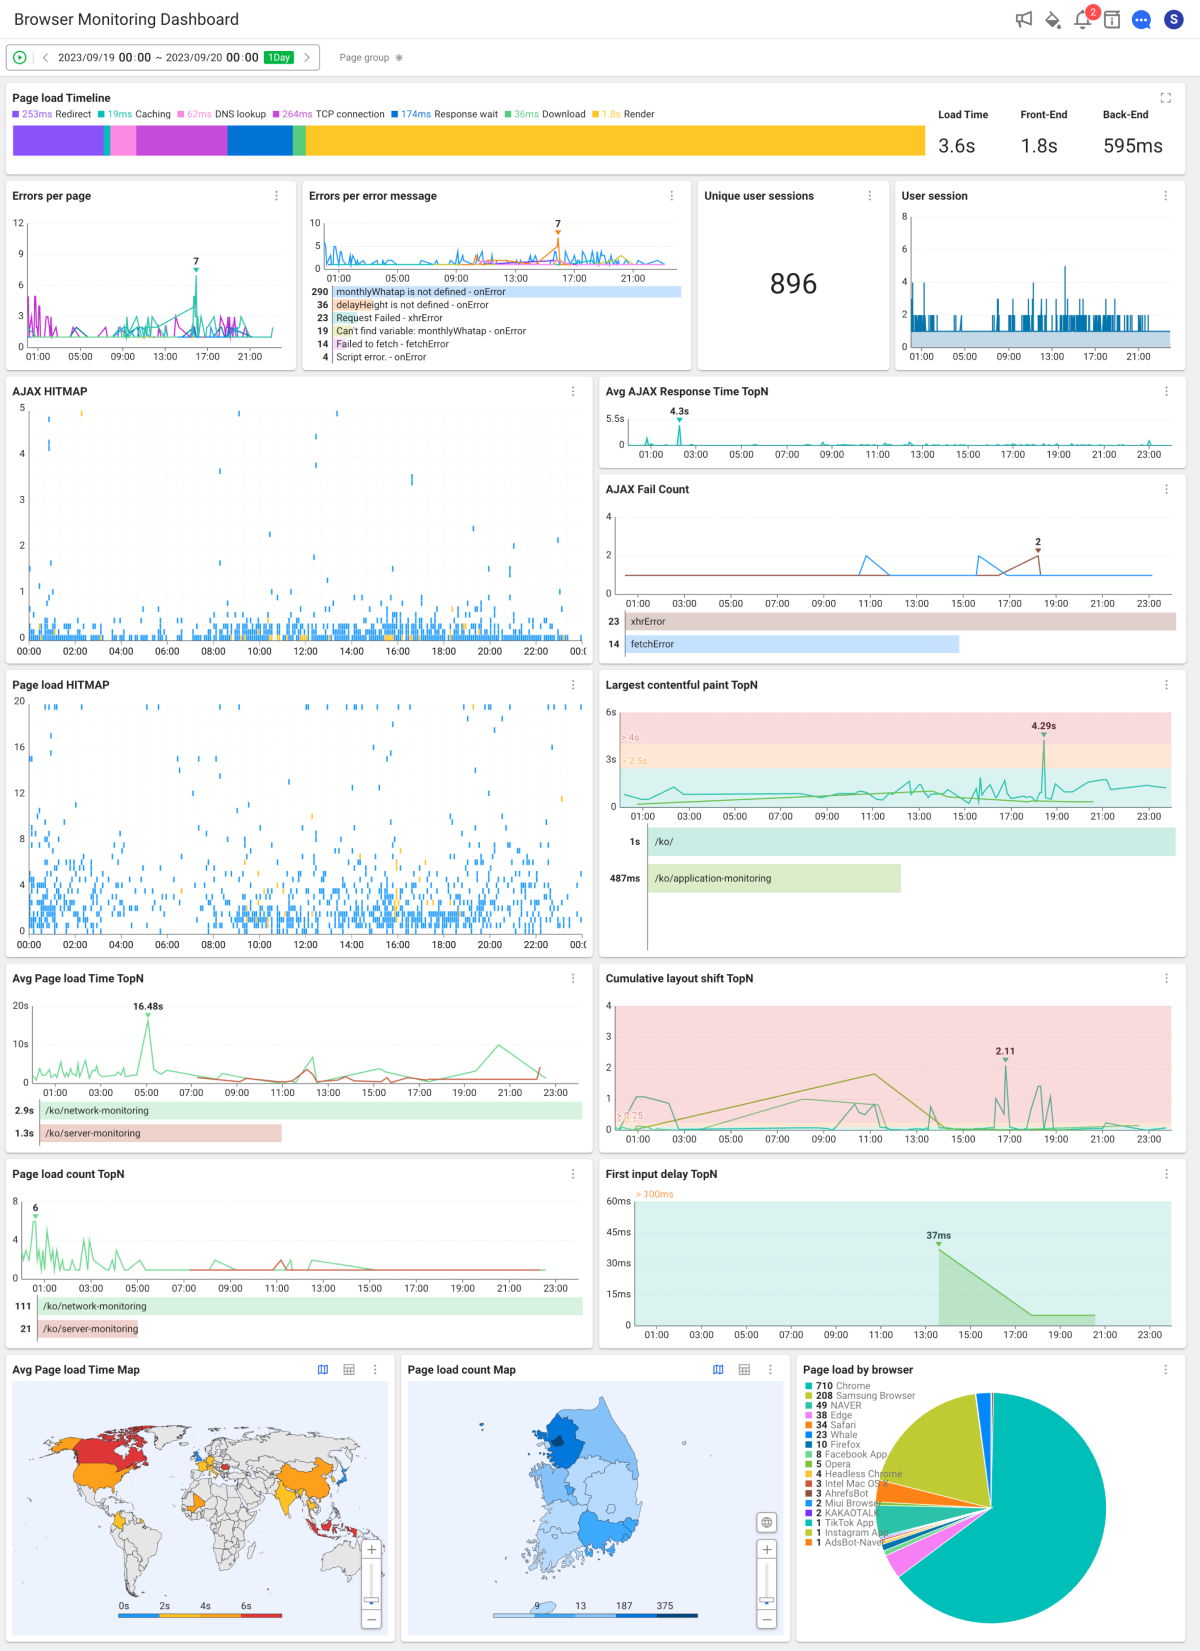
This is a dashboard where you can search real-time and historical data. Monitor the user experiences and performances of the browser applications. It provides data from various aspects, such as performance metrics, browser, and region, so that you can quickly identify health anomalies. It also provides the performance data for page load events and AJAX events.
This dashboard organizes real-time statistical data into chart-type widgets. Statistical data based on the page load and AJAX data generated by the web browser can be checked in real time.
-
On the upper right of each widget, select
 . Then you can see the widget data in full screen.
 -
If you select
 on the upper right of the widget, the chart configuration screen appears. You can set the options to display on the chart.
 -
Depending on the screen size of the web browser, the icon shape on the upper right of a widget may differ. If you select
 , the additional icons appear.
 -
For more information about the widget configuration, see the following.
-
For more information on how to use the time selector, see the following.
Page Load Timeline
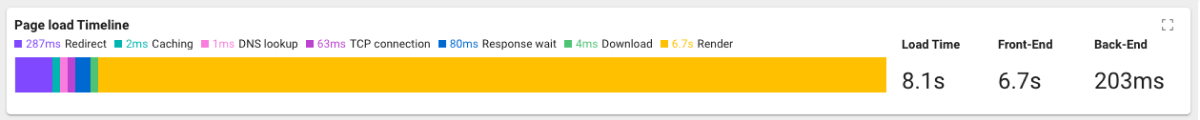
It provides the overall page loading performances for the browser applications. It displays the page load times and the average times for each load step. You can see the overall performance of your browser applications through this.
For detailed descriptions of each step, see the following.
-
Redirect: The average amount of redirection time spent by the browser when loading web pages.
-
Caching: The average time spent by a browser to search cached resources while loading web pages.
-
DNS Lookup: The average time spent by a browser to look up website domains while loading web pages.
-
TCP Connection: The average TCP handshake time spent by a browser when loading web pages.
-
Response Wait: The average time spent from the browser sending network requests while fetching web pages to the first byte receptions from the server.
-
Download: The average time spent for a browser to download resources from the server while loading web pages.
-
Rendering: Average time spent rendering resources downloaded from the server to the screen and completing page load events.
-
Load Time: The average time spent for a browser to fully load web pages.
-
Front-End: Average time taken to initially render web pages.
-
Back-End: Average time taken to download resources by page load requests.
Page loading time and load count
When end users access the web pages via the browser application, they can see in real time how long and how often each page takes to load. With this information, the developers can identify high-traffic and slow-loading pages and prioritize which pages need speed improvements.
For example, if a page accessed by many users takes long time to load, the developers can focus on improving the performance of the page. On the contrary, if a page with slow loading speed has a low traffic, it can be more efficient to invest more development resources in other pages rather than improving the page.
To check the overall status, select Page Group in the upper right corner. In the metrics list, select All.
-
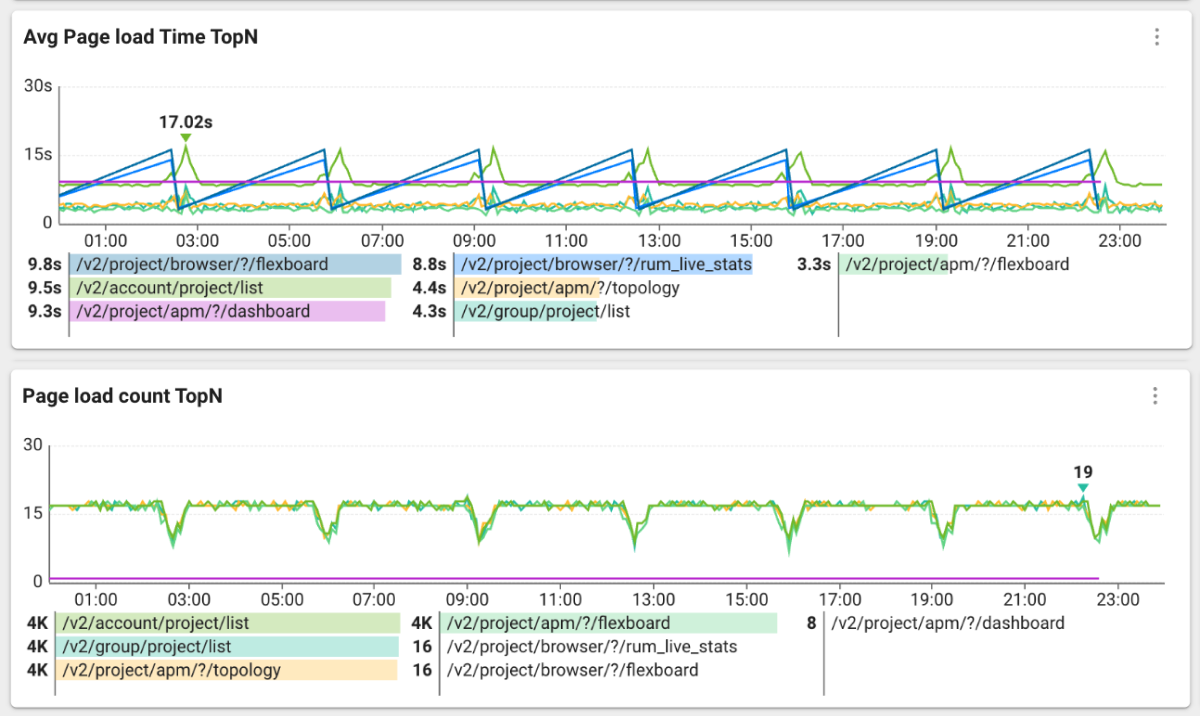
Average Page Load Time TopN
It displays the average page load times by page group. The horizontal bar chart displays the average load times for each page group during the lookup period. Only the top 8 are displayed.
-
Page Load Count TopN
Page load counts are displayed by the page group. The horizontal bar chart displays the sum of loads for each page group during the lookup period. Only the top 8 are displayed.
Page Load Hitmap
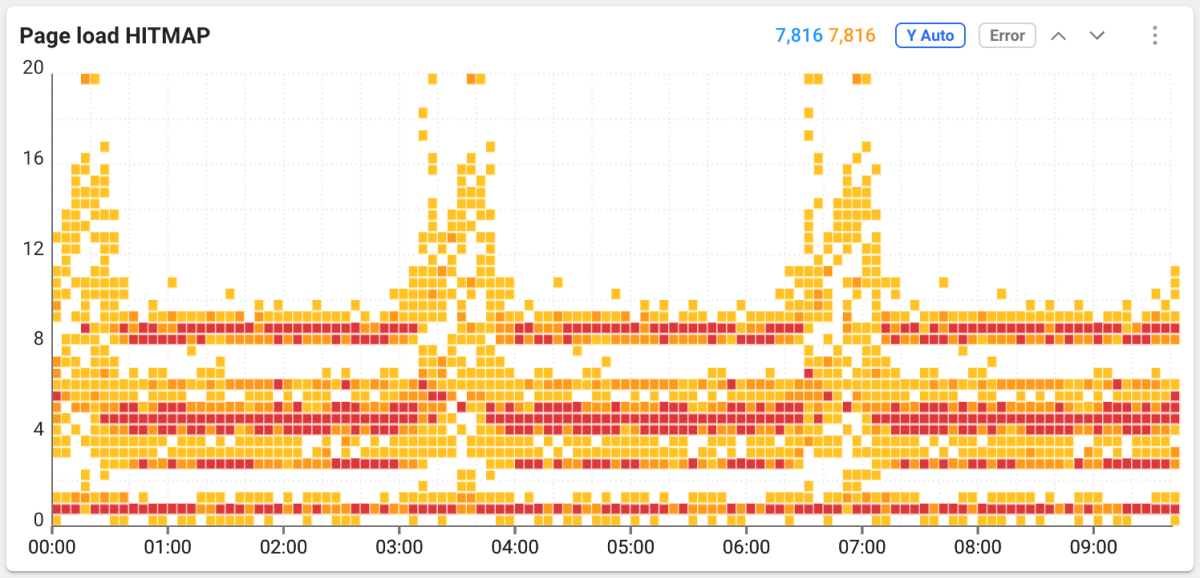
Page Load Hitmap is a distribution chart of response times for page loads over time.
-
The horizontal axis is the end time of the page load event, and the vertical axis is the elapsed time of the page load event.
-
Normal page load events are displayed in light blue → blue → Indigo in order.
-
Erroneous page load events are displayed in yellow → orange → red in order. The erroneous page load event occurs when a browser error is encountered while loading pages.
-
Drag a specific area of the chart to see the detailed information. The Page Load Detail window appears. You can see the detailed information of the load event in the dragged area. For more information, see the following.
Error counts per page and message
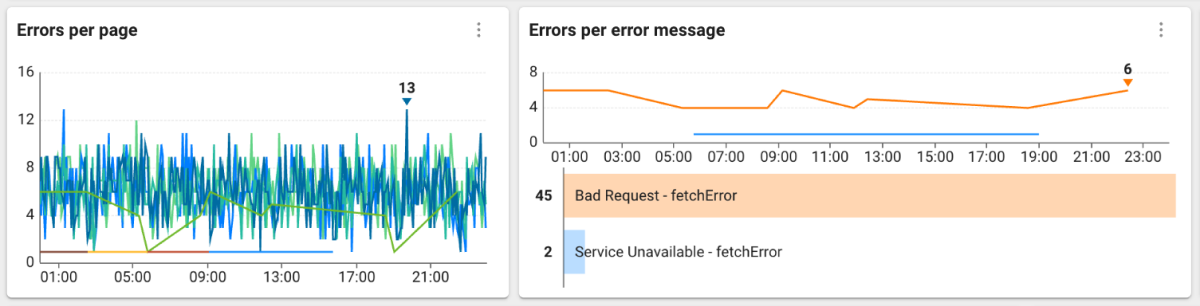
It displays the browser errors encountered by end users while using the browser applications. The errors are displayed for each page and error message. Through this, you can quickly identify the pages where errors usually occur and the content of each error.
-
Page Error Count
It displays the numbers of all errors on each page. If you hover your mouse over the chart, you can see the number of errors in the page group.
-
Error Counts per Error Message
It displays the messages for source and AJAX errors, excluding console errors. The horizontal bar chart displays the sum of errors for each error message during the lookup period. Only the top 8 are displayed.
User session count and user sessions
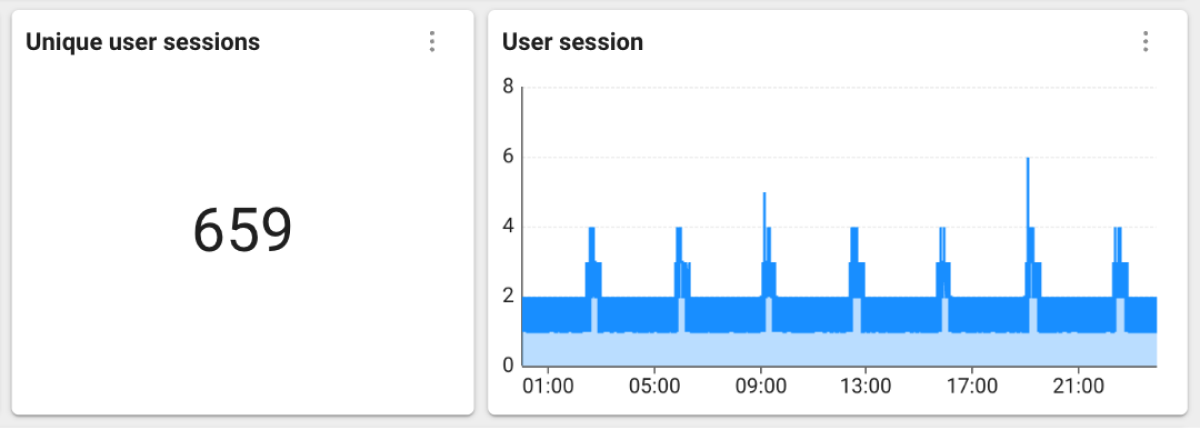
You can monitor the numbers of user sessions accessing the browser applications in real time. You can see the overall usage of your browser applications through this. A sharp increase in the session count indicates an increase in the number of users. On the other hand, if the session count decreases, it is likely that many users are no longer using the application or had uncomfortable experiences.
If you use the wired session widget and other widgets together, you can see a comprehensive view of the application usage.
-
User Session Count
It displays the total number of non-overlapping user sessions based on the lookup time.
-
User Sessions
It displays the numbers of non-overlapping user sessions every 5 seconds, 5 minutes, and 1 hour. Select
on the upper right of the widget, and then select Change Metric. You can select a desired time interval.
Average AJAX Response Time TopN
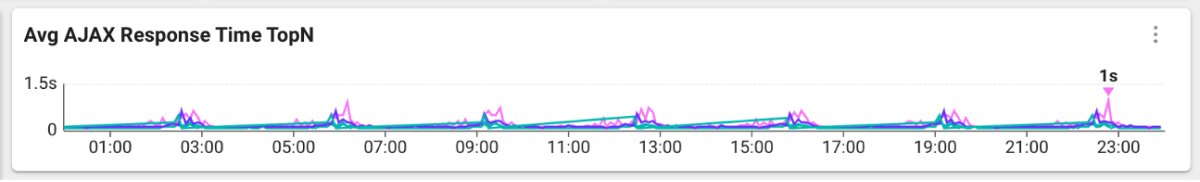
Browser applications frequently send and receive data for rendering via AJAX. On pages where AJAX events continue to occur after page loads, the load of AJAX can be used as an important metric for user experience to browser applications. The Average AJAX Response Time TopN widget displays the average AJAX response times when end users are using the browser applications.
-
It provides charts for each AJAX request path. You can select and check the charts by the request host, request page, and overall average. Select
on the upper right of the widget, and then select Change Metric. You can change the chart data. -
By default, the top 10 data appears based on the lookup time. To change the data count, select
on the upper right of the widget and then select . If you select the Top N button on the upper right of the screen, the option to change the count appears.
AJAX failure count
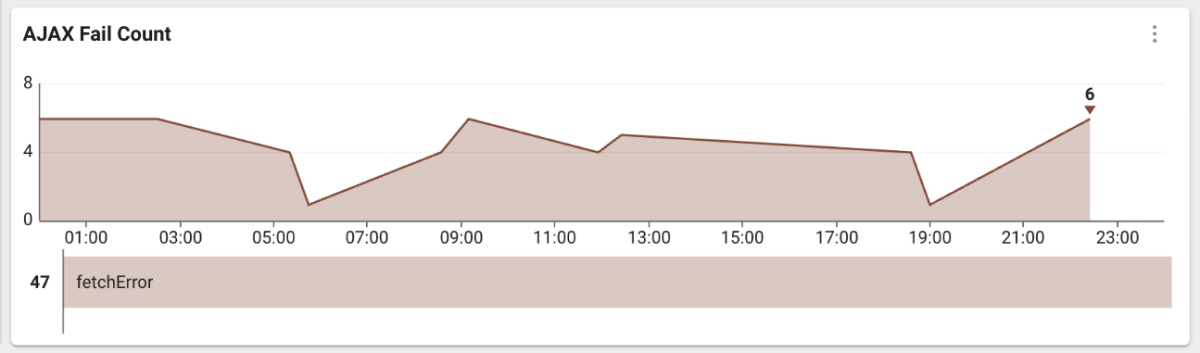
The AJAX error indicates that the status code is 400 or higher or the request has been canceled because the request itself could not be executed. It displays the number of AJAX errors occurring in the browser applications by classifying them by the fetch or XHR type.
AJAX HITMAP
AJAX requests from browser applications are provided in the form of a hitmap chart, and the detailed information on each request can be viewed in a table form. By analyzing each AJAX, you can pinpoint the cause of the performance anomaly.
For more information about AJAX Hitmap, see the following.
Hitmap Chart
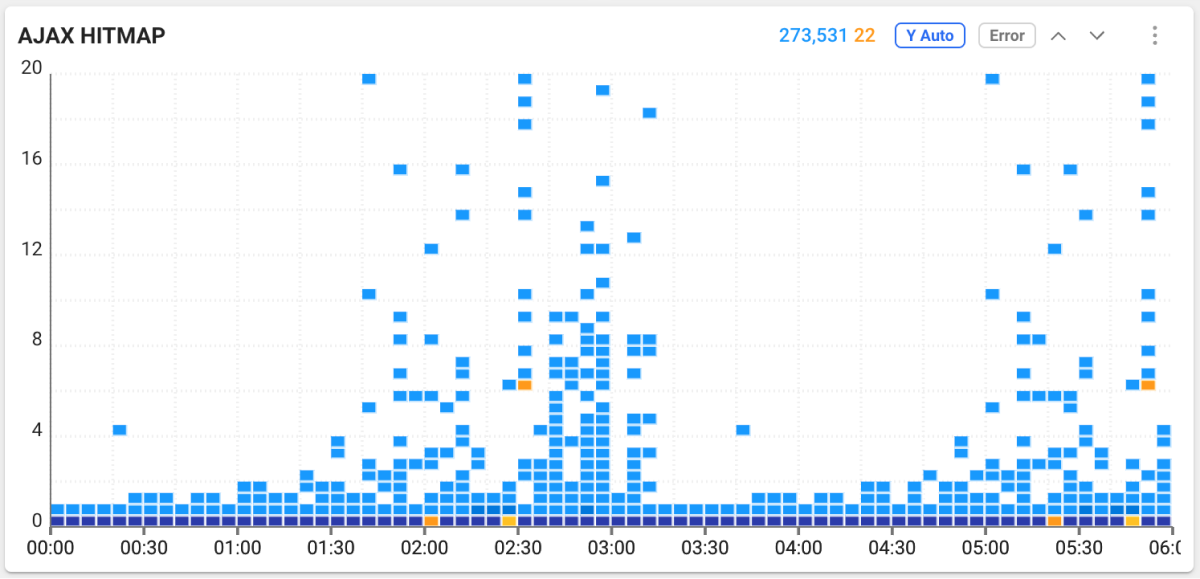
The AJAX hitmap chart displays a distribution of the response times of AJAX requests over time.
-
The horizontal axis is the AJAX end time, and the vertical axis is the AJAX load time.
-
Normal AJAXs are displayed in light blue → blue → Indigo in order.
-
Erroneous AJAXs are displayed in yellow → orange → red in order. Their state code is 400. To see only the errors on the chart, select Error on the upper right of the widget.
-
If Y Axis Auto is active, the maximum value of the Y axis automatically changed depending on the distribution. To fix the Y-axis, select Y-Axis Auto to disable it.
-
Select
 or
or  to move the chart location up or down.
 -
Drag a specific area of the chart to see the detailed information. To display the AJAX event list and details of the dragged area, the AJAX Analysis window appears.
AJAX Event Detailed Information
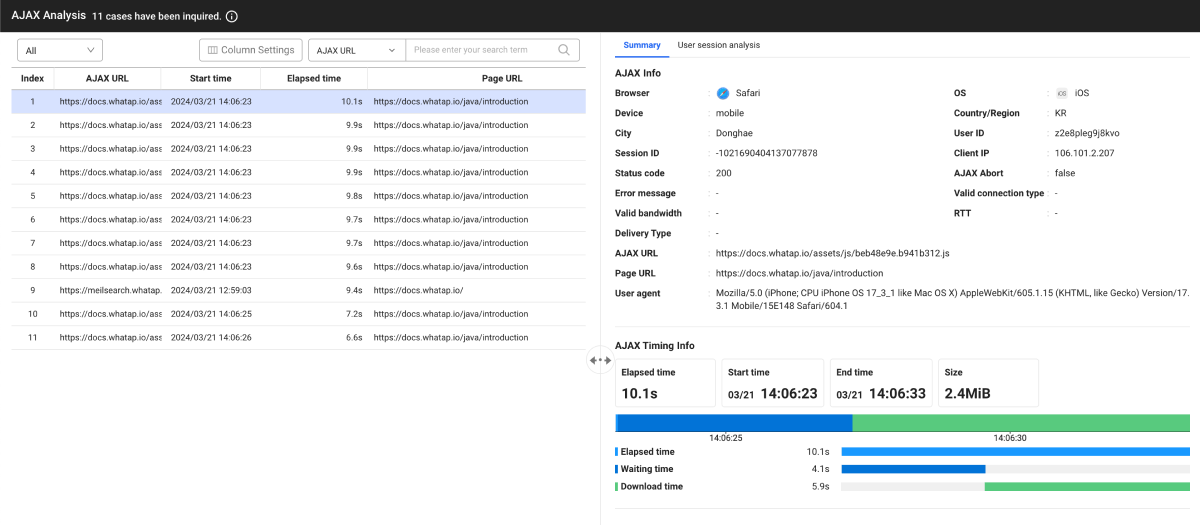
If you select each item in the AJAX Analysis window, the AJAX Info window appears on the right to display the detailed information.
To see only the AJAX list that has errors, on the upper left of the AJAX Info window, select from the Error All choose list.
Each AJAX has the following information:
-
AJAX URL
-
URL of the page that requested AJAX
-
Browser, device, and OS information
-
Error message
-
Regional information
-
AJAX detailed timing
Page load times and counts per region
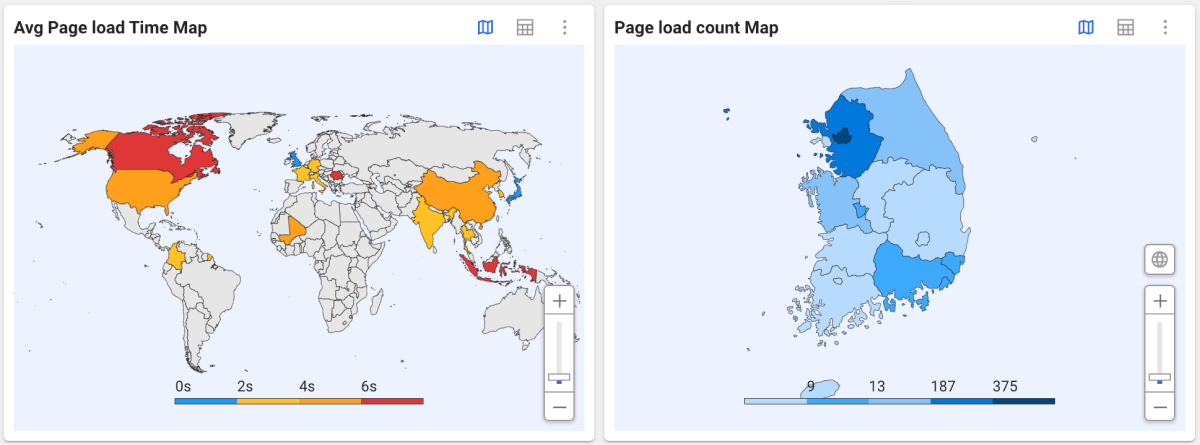
It displays the page load times and counts by region for browser applications in the map chart and table. You can easily compare the website performances for each region. The page load time displays the legend every 2 seconds, and the page load count displays the legend at 50, 75, 90, and 95 percentile intervals.
The widget displays the countries with the highest page load based on the search time.
-
You can scroll the mouse wheel or use the slider to zoom in or out on the map.
-
To view the world map, select
 . You can select a country to see its regional data.
 -
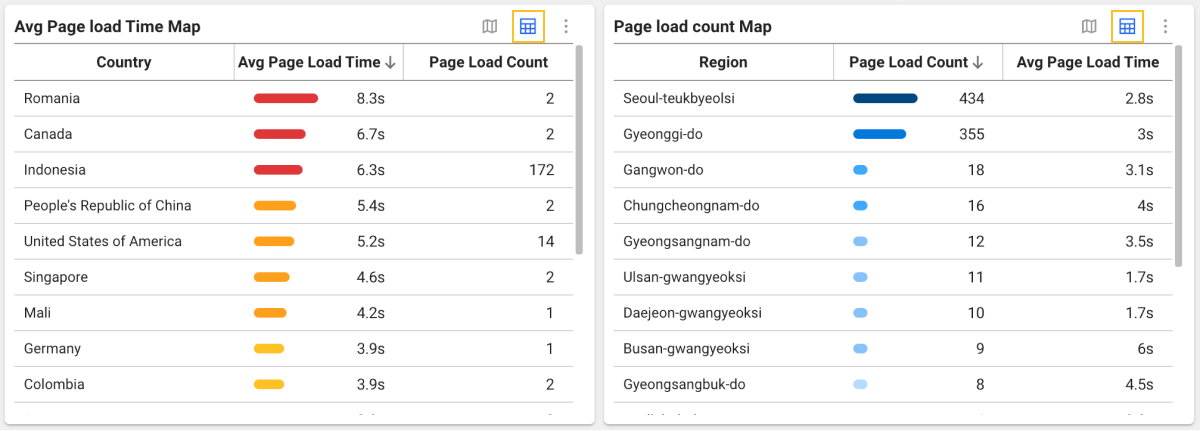
To see the data in a table format, select
 . To return to the map format, select
  .
.
-
In case of regional maps, data appears based on the upper administrative district. (Korea: province or metropolitan city)
This site or product includes IP2Location LITE data available from https://lite.ip2location.com.
Page Load By Browser
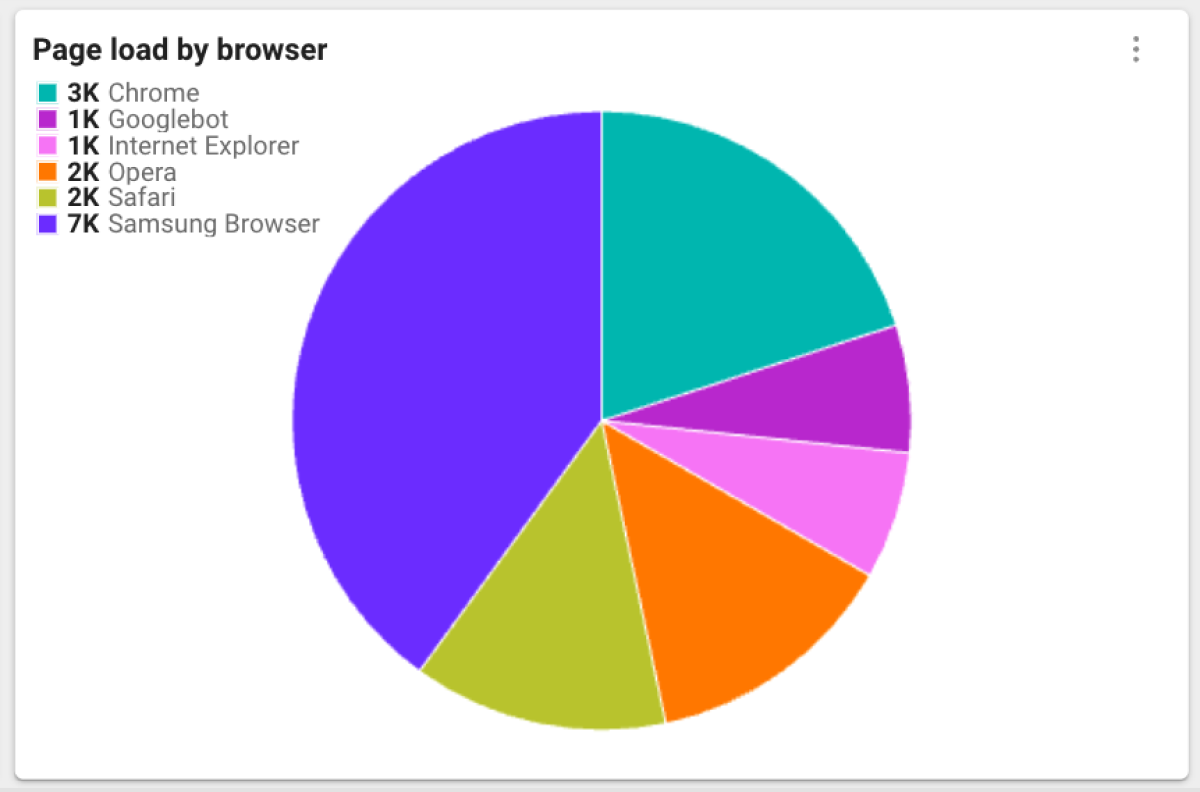
It provides the page load times and page load counts for browser applications. You can easily compare the performances of different browsers. To change the data to Page Load Time or Page Load Count, select ![]() on the upper right of the widget, and then select Metrics.
on the upper right of the widget, and then select Metrics.
Core Web Vitals Metric
Core web vitals are three important metrics related to the website performance among various metrics that affect user experience as defined by Google. Metrics are displayed differently depending on the website loading and interaction with users.
-
Largest Contentful Paint: A metric that measures the time loaded for the largest content element on your website.
-
First Input Delay: Time taken between the website loading and user's first input.
-
Cumulative Layout Shift: A metric of how often the layout changes while the website is loaded.
These measurements play an important role in evaluating and improving the website performance. Understanding and measuring the core web vitals metrics is very useful to improve user experiences and optimizing the website performance.
Largest Contentful Paint
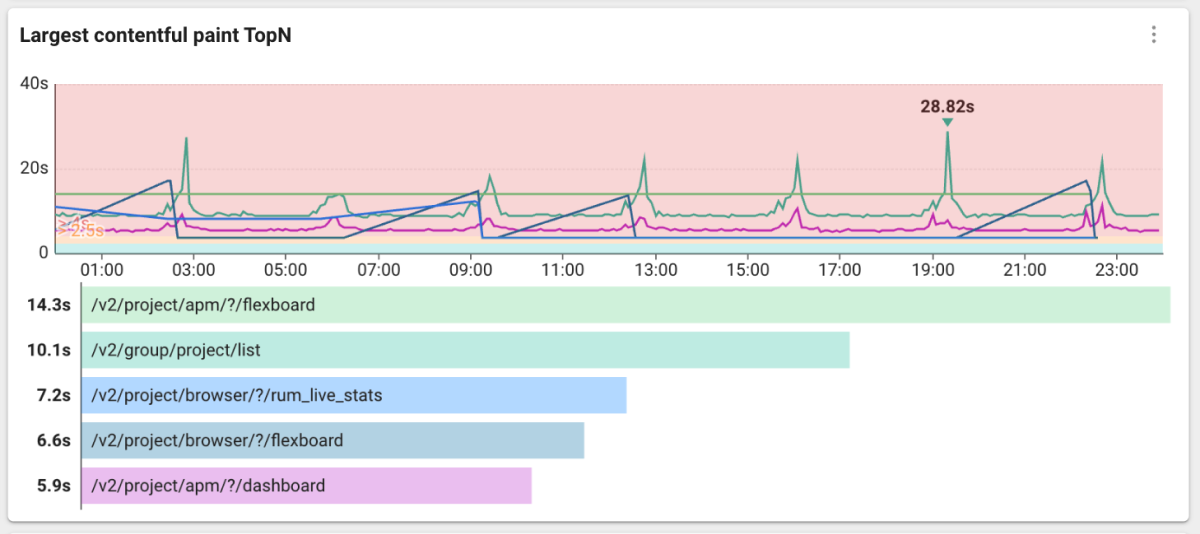
It displays the average maximum contentful paint time for each page group. It displays the averages of maximum contentful paint times for the top 8 groups of each page group during the lookup time in a horizontal bar chart.
First Input Delay
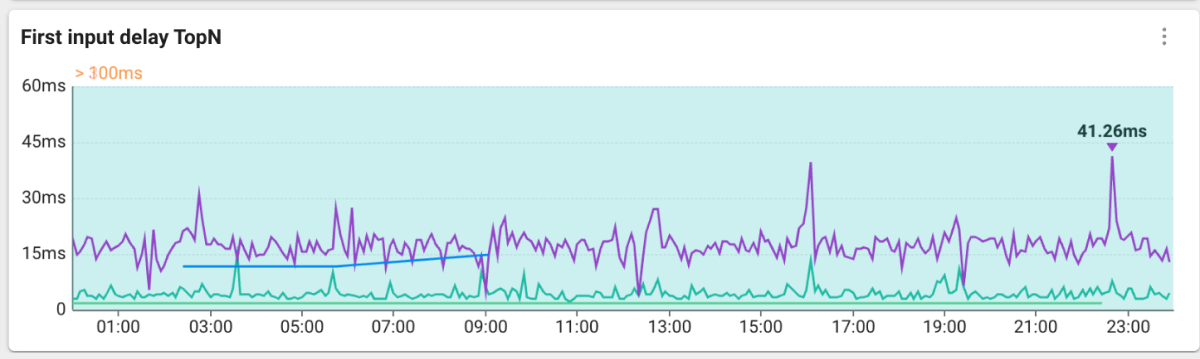
It displays the average initial input delay times for each page group. If you hover your mouse over the chart, the time value for the page group appears.
Cumulative Layout Shift
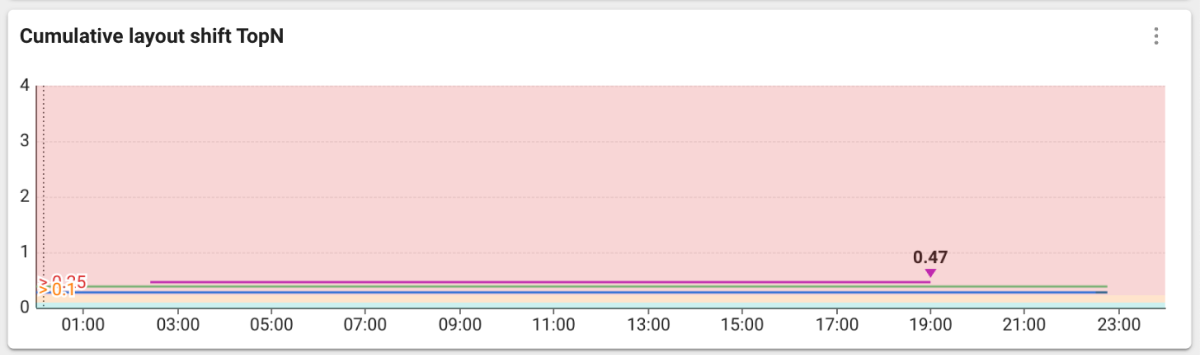
It displays the cumulative layout values for each page group. If you hover your mouse over the chart, the value for the page group appears.