Collecting custom events
It may be difficult to identify problems with web services and improve user experience only with basic information collected through the browser monitoring. To handle those difficulties, it provides an interface that allows developers and operators to additionally collect desired events that occur on the website.
The following event types can be additionally collected through the interface provided by the browser agent:
- Information on specific function calls for debugging
- Logic execution information related to the sales
- Button click information that directly affects the sales
You can use custom events as follows:
-
Understanding and improving user experience
By tracing the behaviors or visited paths of specific users, we can better understand how users interact with the website and improve user experience. For example, measuring the clicks of specific buttons within the website or the transition speed between pages can help you discover and fix user experience issues.
-
Identifying and resolving performance issues
Custom events can help you identify performance issues for specific features or components. You can trace the times to perform specific tasks and collect performance data to find bottlenecks. If you can address these performance issues, the overall performance of your website can be improved.
-
Provision of business insight
By understanding how users interact with web applications and website, valuable information for business decisions can be obtained. By analyzing information such as most frequently used functions and chosen paths in web services, you can use the information for developing desired functions or marketing strategies.
-
Generating custom notifications and alerts
By configuring notifications for specific event conditions, you can quickly detect and respond to system failures or unexpected user behaviors.
Collection data format
-
name: Name that represents the event. It is recommended not to include unique IDs that cannot be grouped, such as random numbers or product numbers. -
duration: Time between a page load or page transition and an event occurrence. -
custom_duration: Execution period of a custom event. You can set the time at which a specific event is performed by directly specifying the start time and end time. -
contents: Processed results of custom events.
How to apply and collect codes
You can send custom events to WhaTap via the addCustomEvent method among the interfaces provided by the browser agent.
Interfaces
The interface provided by the browser agent is contained in the WhatapBrowserAgent object of window. See the interface of addCustomEvent provided by WhatapBrowserAgent.
addCustomEvent: (
    eventName: string,
    option: {
      contents: string | undefined;
      customDuration: number | undefined;
    } | undefined,
) => void;
Application example
You can apply the interface provided by the browser agent as an example code.
function PurchaseProduct(payload) {
  const startTimestamp = new Date();

  ...

  const endTimestamp = new Date();

  const duration = endTimestamp - startTimestamp;

  window.WhatapBrowserAgent?.addCustomEvent('purchase product', {
    contents: JSON.stringify(payload),
    customDuration: duration,
  });
}
When the PurchaseProduct function is run, custom events are sent with the specified name value.
Viewing the collected data
Using the user session log search menu
-
Select a browser monitoring project and then go to Analysis > User Session Log Search.
-
In the Filter option, select the
typetag and then enter "custom."
-
Select
.
-
You can additionally select the
nametag from the searched results and then filter out specific values.
-
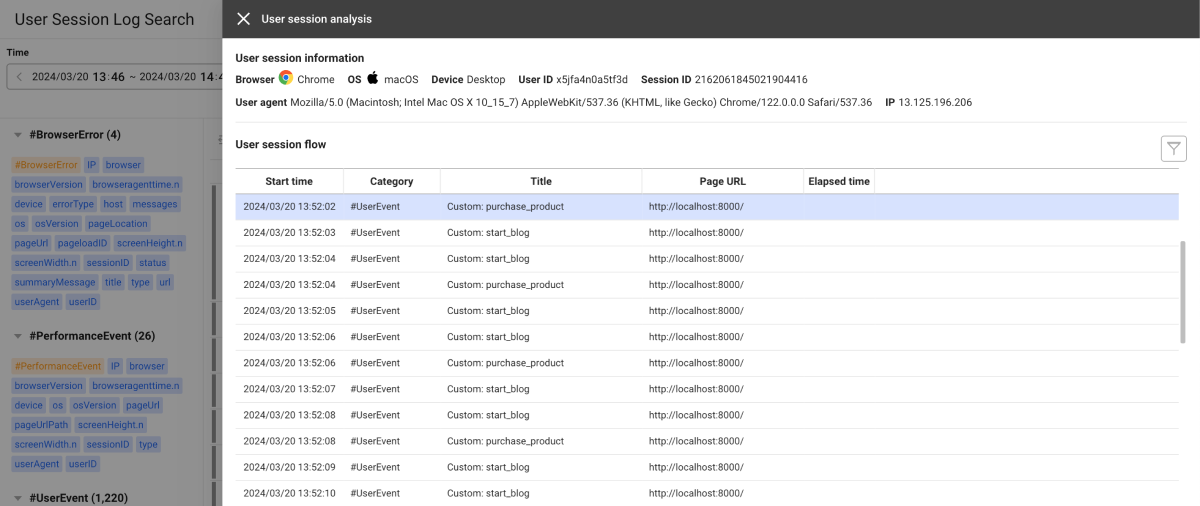
To see user behaviors until an event occurs, in the User session analysis column from the searched result list, select Analysis.

For more information about the user session analysis, see the following.
Checking with widgets on the Flex board
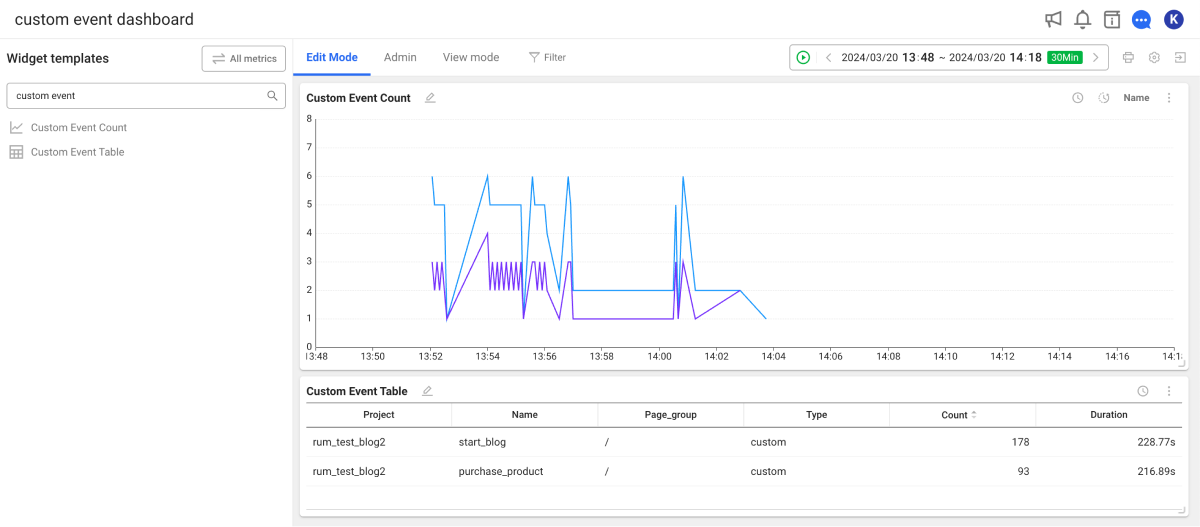
You can view custom event data by creating a widget in Flex Board.

-
Custom event count: You can see the trend in collected custom events.
-
Custom event table: You can see the list of the collected custom events.