Browser Error
Home > Select Project > Dashboard > Browser Error
The Browser Error dashboard monitors and visualizes errors of the browser application and displays them in real time. Through the dashboard, you can quickly identify errors, find their causes, and fix them. It provides various data such as AJAX error counts for each page and error type and error counts for each browser and error message.
-
On the upper right of each widget, select
 . Then you can see the widget data in full screen.
 -
If you select
 on the upper right of the widget, the chart configuration screen appears. You can set the options to display on the chart.
 -
Depending on the screen size of the web browser, the icon shape on the upper right of a widget may differ. If you select
 , the additional icons appear.
 -
For more information about the widget configuration, see the following.
-
For more information on how to use the time selector, see the following.
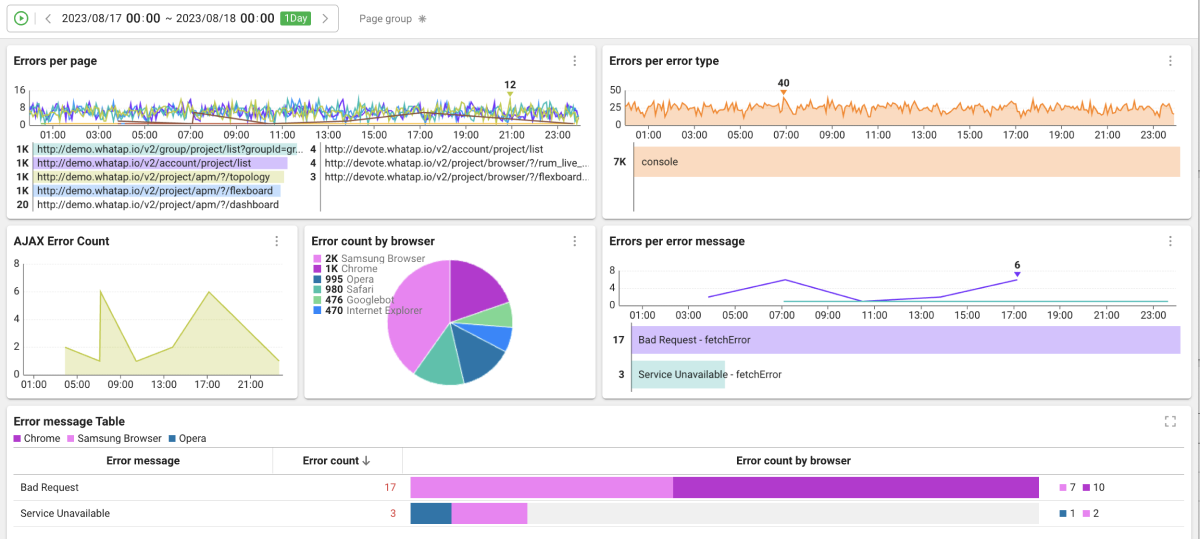
Errors per page
It displays the numbers of all errors on each page. Hover your mouse over the chart to see the number of errors in the page group with a tooltip. The horizontal bar chart is the sum of error counts per page during the lookup time, with only the top 8 errors displayed.
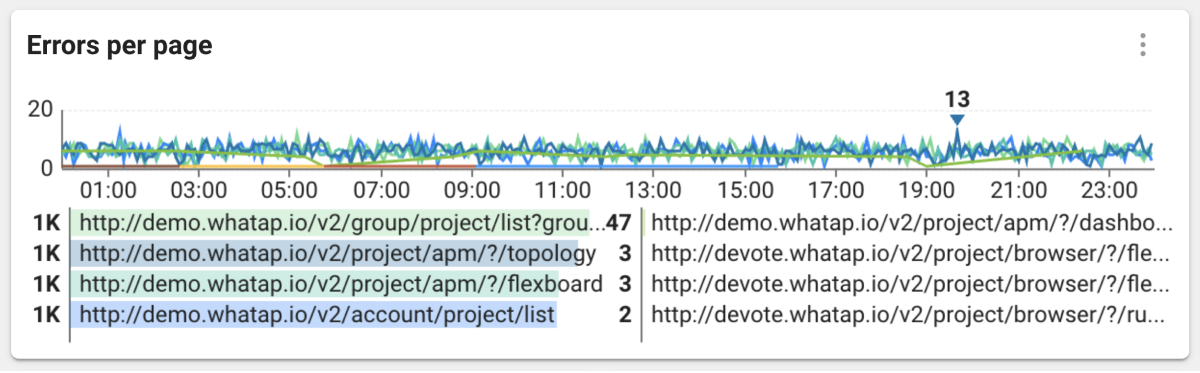
Errors per error type
It displays the console and source errors. The horizontal bar chart is the sum of error counts per error type during the lookup time, with only the top 8 errors displayed.
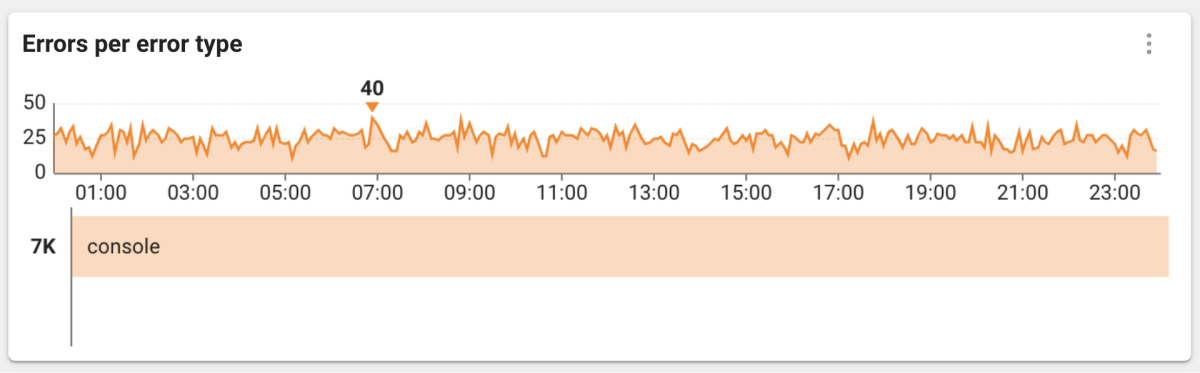
AJAX error count
It displays the number of AJAX errors occurring in the browser applications by classifying them by the fetch or XHR type. The AJAX error indicates that the status code is 400 or higher or the request has been canceled because the request itself could not be executed.
Error count by browser
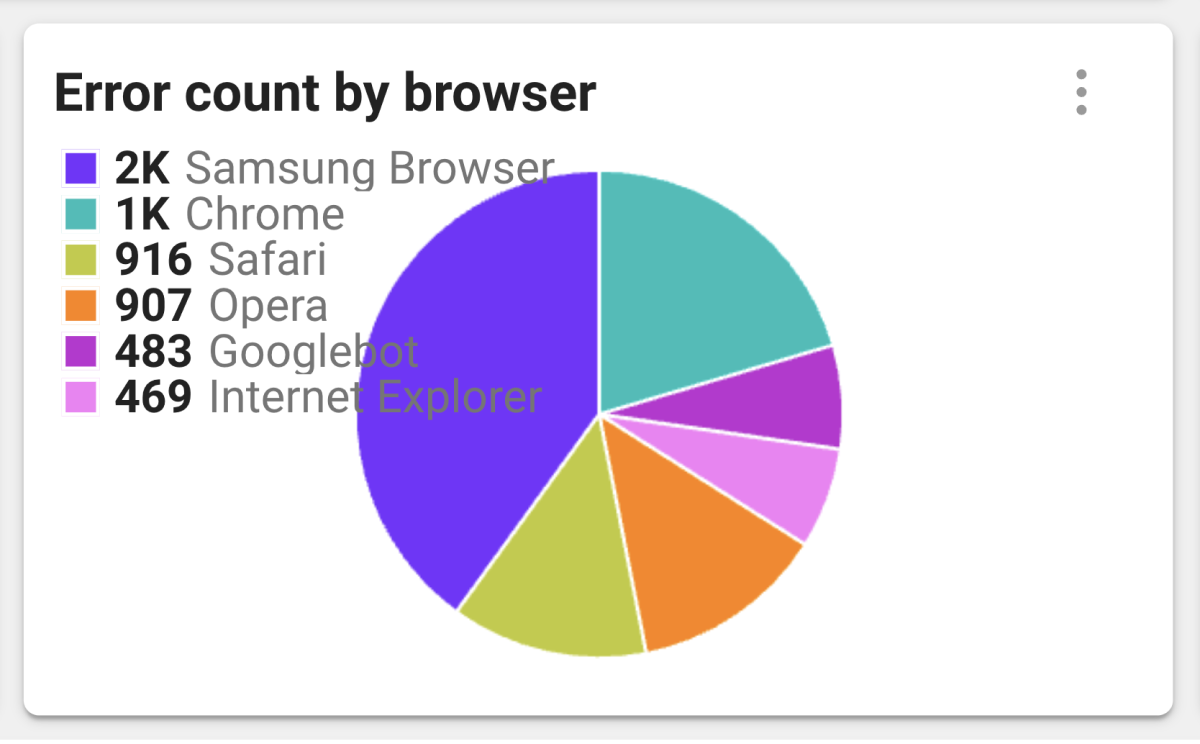
It displays the error counts for each browser in a pie chart. You can easily figure out which errors your browser is experiencing most often. If a specific browser has more errors than other browsers, the developer can proceed with optimization for the browser.
Errors per error message
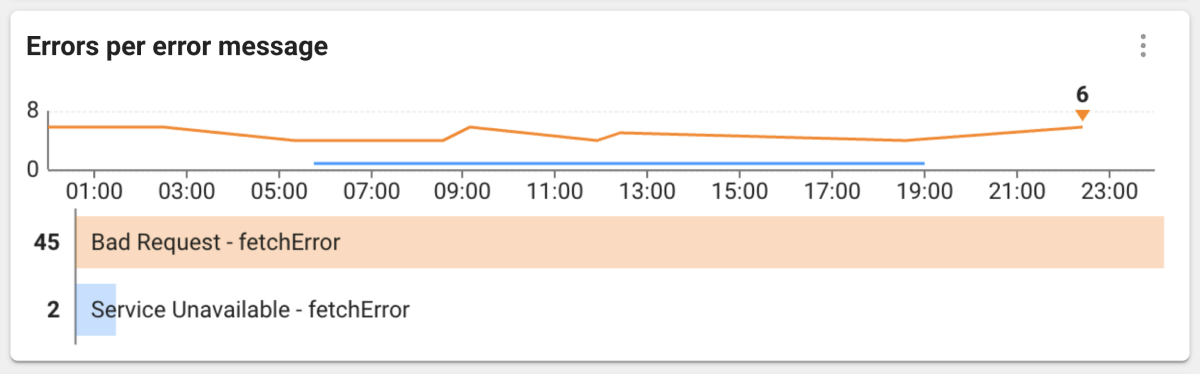
It displays the messages for source and AJAX errors, excluding console errors. The horizontal bar chart is the sum of error counts per message during the lookup time, with only the top 8 errors displayed.
Error message table
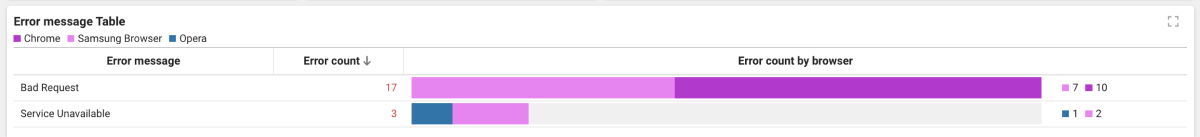
It displays the error counts by error message and the error counts by browser in a table. You can find which browsers are causing most errors and use them to troubleshoot. It is also useful for identifying the root causes of errors. If a new error occurs, you can quickly respond by seeing this table.
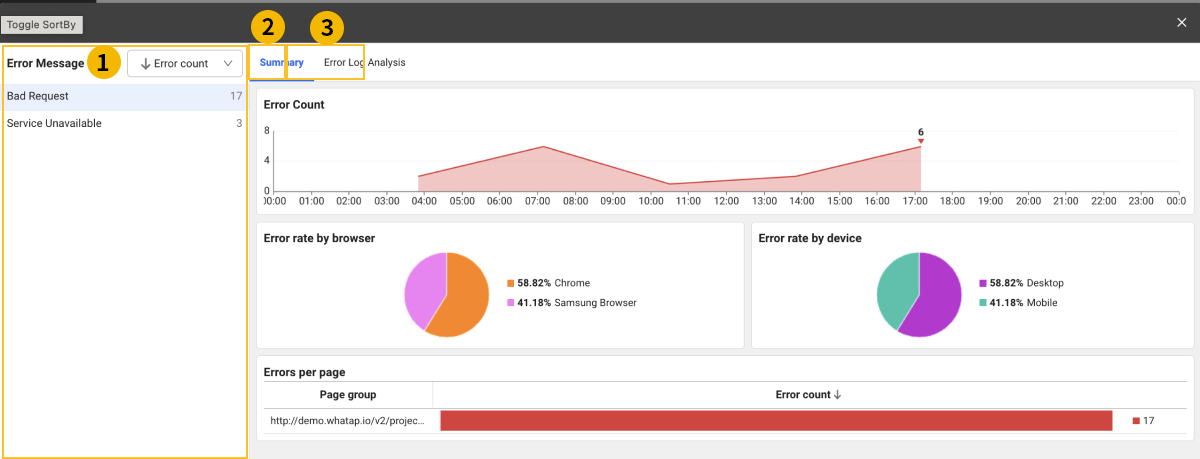
Checking the error message details
If you select an error message from the Error message Table list, you can see the statistics details based on the error message.
-
 Error Message
You can check the list of error messages based on the inquiry time. If each error message is selected, you can see the detailed information.
-
 Summary
Through the graph chart, you can see the Error Count, Error rate by browser, Error rate by device, and Errors per page for each time zone.
-
 Error Log Analysis
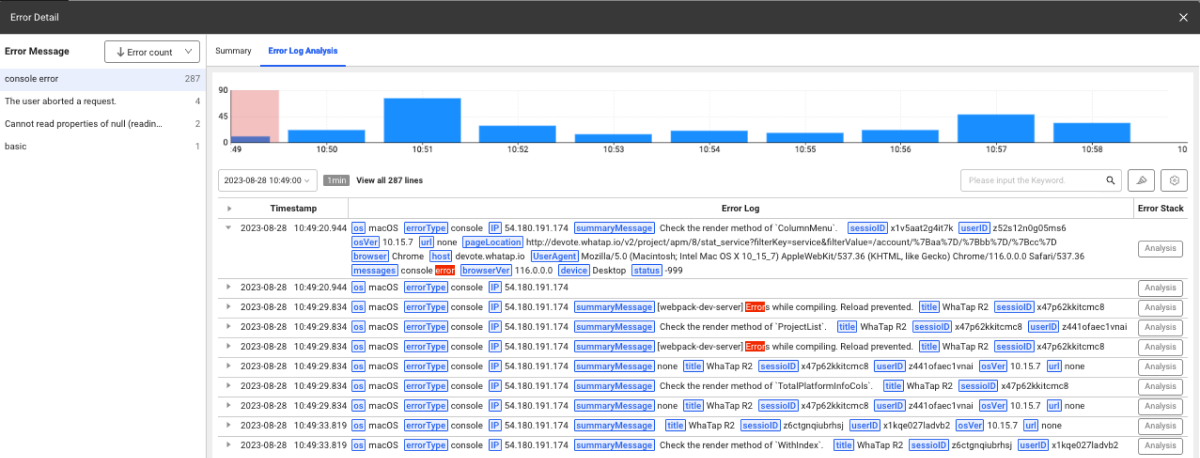
You can see the error logs by the time zone. If you select Analysis for the Error Stack, the error stack information window appears for the selected error log. For more information, see the following.