Application of the browser agent
To use the WhaTap monitoring service, after Sign up, create a project and then apply the WhaTap browser agent to web applications.
See the following video guide.
Creating a project
Create a project before installing the agent.
-
Log in WhaTap monitoring service.
-
To create a project, on the left of the screen, select All Projects > + Project.
-
Select a product in Select product for installation.
-
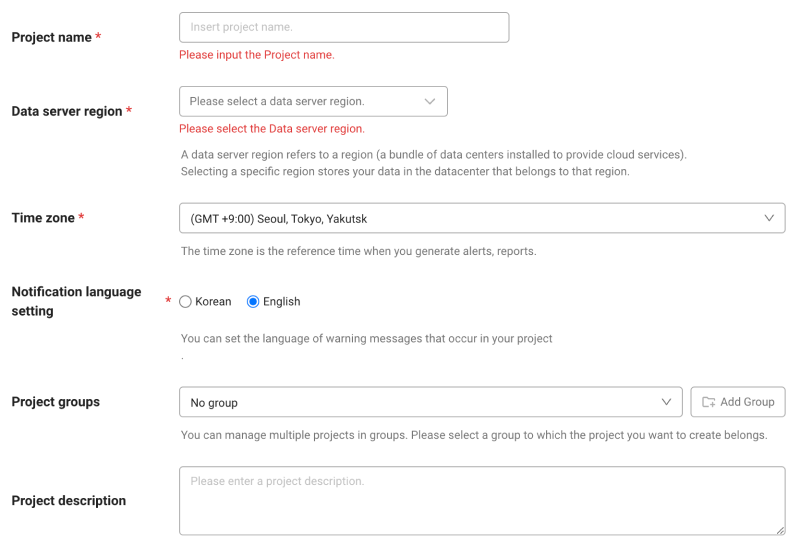
Configure the settings for Project name, Data server region, and Time zone.
-
In Notification language setting, select the language for alert messages.
-
After all settings are finished, select Creating a project.
-
A Data server region refers to a region (a bundle of data centers installed to provide cloud services). Selecting a specific region stores your data in the datacenter that belongs to that region.
-
Time zone is the reference time for generating alerts and reports.
-
To group multiple projects for management, select a group from Project groups or add a group. For more information about grouping, see the following.
-
To add a project with an organization selected, Groups of organization must be set.
Checking the project access key
Project access key is the unique ID for activating the WhaTap services.
In the installation guide section, select Getting the access key. After automatic reception of project access key, proceed to the next step.
After a project has been created, the Agent installation page appears automatically. If the Agent installation does not appear, select All projects on the left and then select a newly created project.
Installing the WhaTap browser agent
Follow the instructions on the agent installation screen to apply the WhaTap browser agent code to your web application.
 Data collection sampling
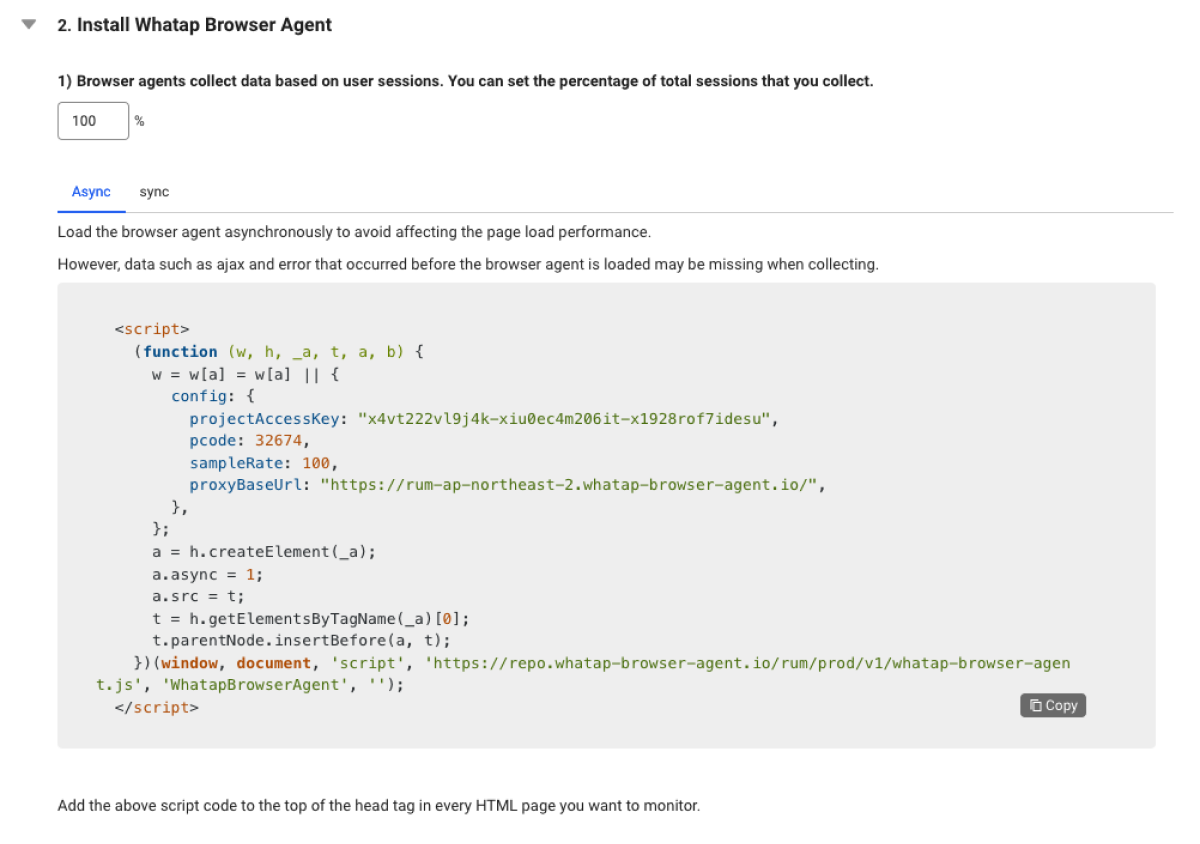
The WhaTap browser agent collects data based on the user session. You can set the percentage of all sessions collected from 0 to 100.
 WhaTap browser agent script
The WhaTap browser agent is provided in the form of an inline script. Add the script code provided by the installation guide to the top in the <head> tag of any HTML page to monitor.
Select one of the following two methods to apply the agent.
- Async (Asynchronous Load): Loads the WhaTap browser agent asynchronously in your web application.
- It does not affect the load performance of your web application.
- There may be missing data such as AJAX or errors that occurred before loading the browser agent.
- Sync (Synchronous Load): Loads the WhaTap browser agent synchronously in your web application.
- It is recommended if you want to collect all data when loading your web application.
- It may affect the load performance of your web application.
Setting the WhaTap browser agent's options
It sets the options to apply to the WhaTap browser agent. The options can be set in the Config object of the installation script. You can set the project access keys, percentage of all user sessions, resource domains to exclude from collection, and such.
config: {
  projectAccessKey: {projec_access_key},
  pcode: {pcode},
  sampleRate: 100,
  ignoreOrigins: [ 'https://ignore-site.com/' , '/^(https?://)([^/]*)(ignore-site.io)(/)(.*)/i' ],
  collectUserClick: false
}
-
projectAccessKey: Project access key
-
pcode: Project code.
-
sampleRate: You can set the rate of user sessions that are collected.
-
ignoreOrigins: You can add specific resource domains to be excluded from statistics collection in the form of an array of strings. You can also apply regular expressions.
-
collectUserClick: Click events can be collected. The default value is
false.
The projectAccessKey and pcode values are recommended to import the script code in the installation guide for use.
Next steps
-
Collecting custom events
To identify the web service issues and improve user experience through browser monitoring, it provides an interface that allows developers and operators to additionally collect desired events that occur on web pages. For more information about custom events, see the following.
-
Setting the actual user ID
In the browser monitoring, you can collect data by setting the user ID via the actual user's login ID or email address. You can check the user session performance and event information based on the actual login ID, and then check the browser's errors to identify problems. For more details, see the following.
-
Configuring the session replay
Session replay is a feature that allows to record and replay all events performed by users on the website. This feature allows you to reproduce user behaviors such as clicking, scrolling, typing, and page switching. This helps you understand exactly how users actually interact with the website. For more details, see the following.
-
Starting the monitoring
Go to WhaTap Monitoring Service and then start the browser monitoring. Select a created project and then go to Dashboard > Browser Monitoring Dashboard. You can see the monitoring status. For more information about Browser Monitoring Dashboard, see the following.